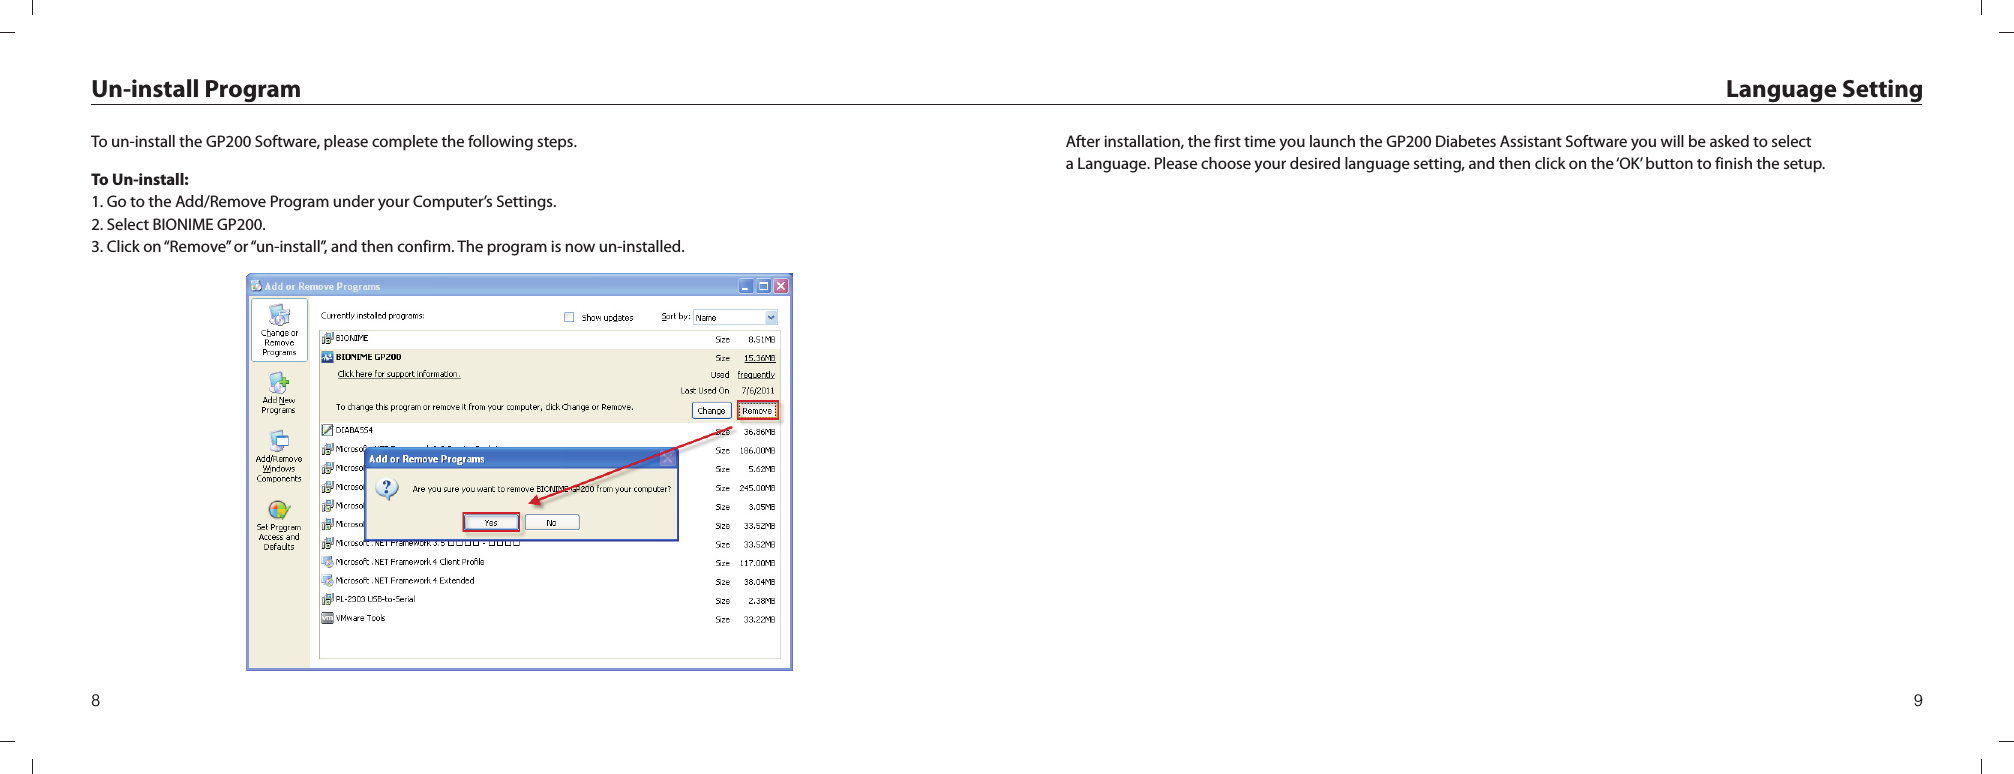
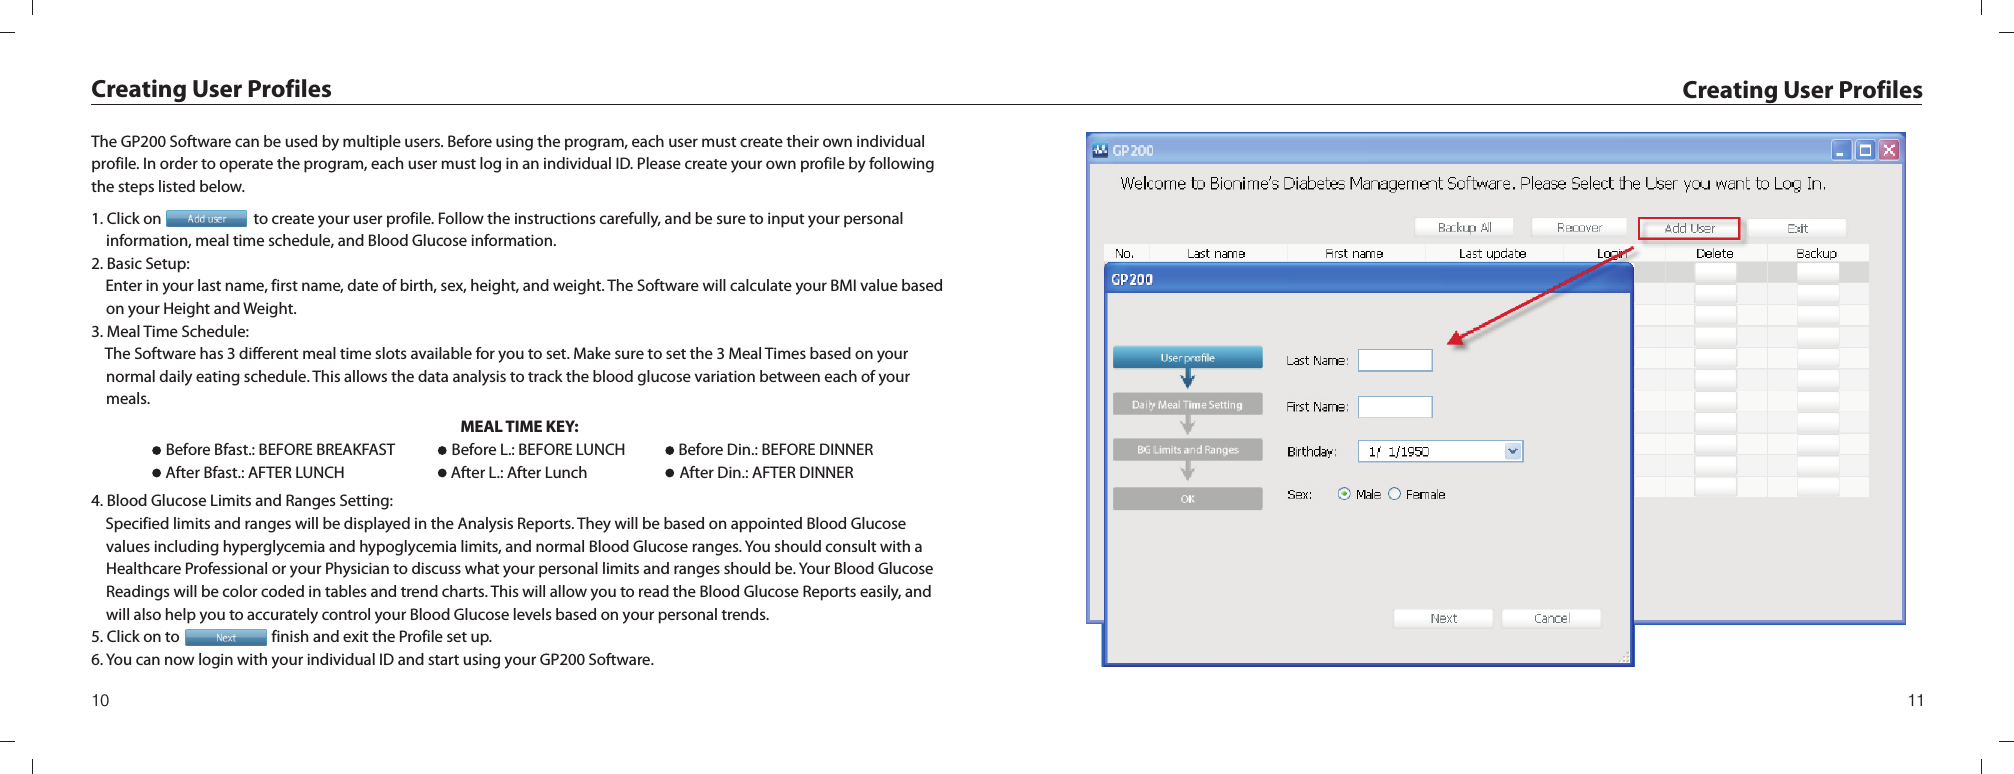
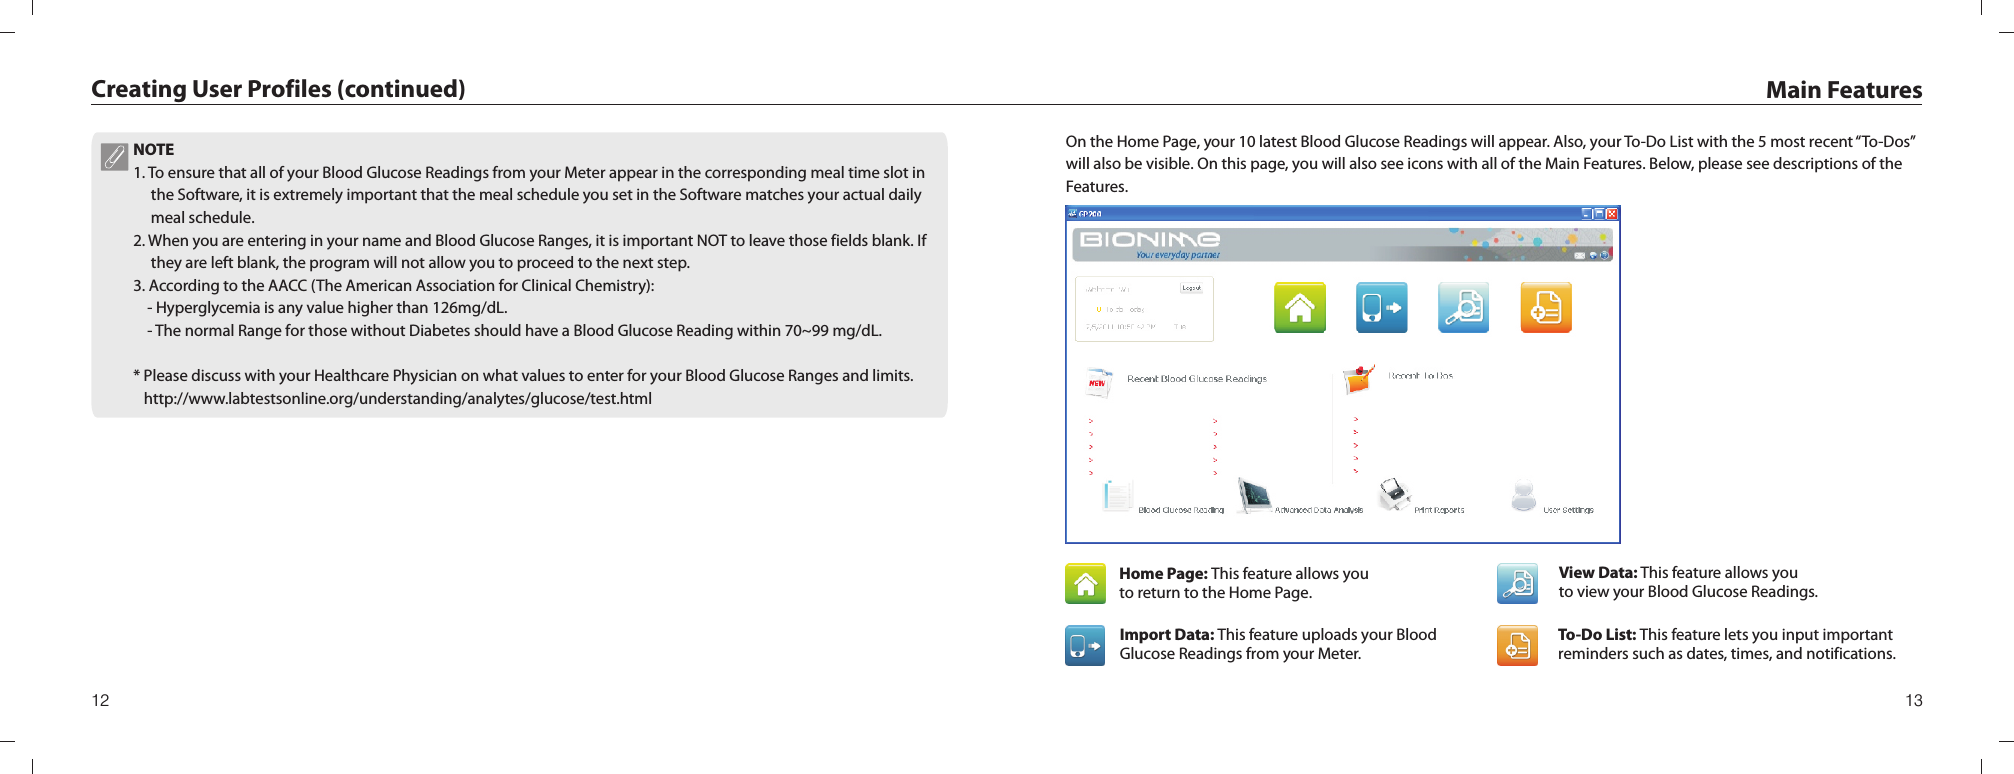
Bionime GP700 PC Link Adaptor User Manual Manual
Bionime Corporation PC Link Adaptor Manual
UserManual.wiki
>
Bionime
>
GP700 User Manual
Manual
Navigation menu
Upload a User Manual
Namespaces
Wiki Guide
HTML
PDF
Info
Views
User Manual
Discussion / Help
Navigation

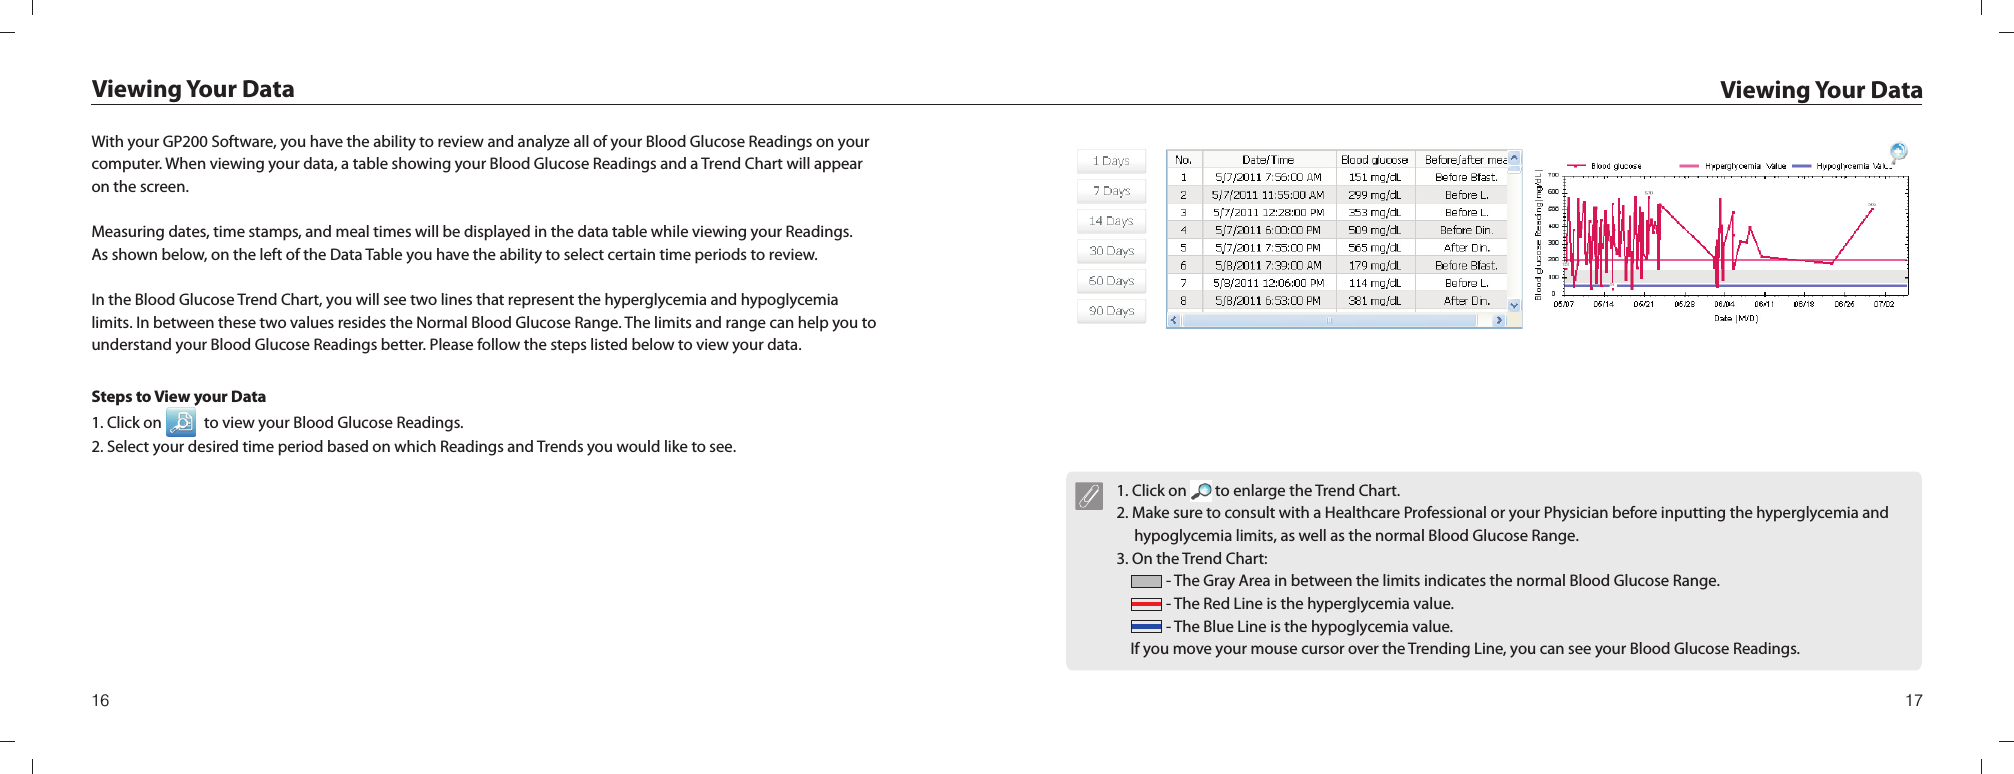
![1918 Data AnalysisBy clicking on you are able to view and analyze all of your Blood Glucose Readings, as seen on the followingpage.Data Analysis Tools:1. You have the ability to choose different time periods to view your Blood Glucose Readings. What you see on the display screen will be adjusted based on the time period you selected.2. You can also review your Blood Glucose Readings by selecting different meal times. You have 9 meal times that you can choose from: before/after breakfast, before/after lunch, before/after dinner, before/after meal, or View All Data. Your data will be displayed based on your selection.3. Your Blood Glucose Readings will be represented by different colors, based on its value. Below is a Color Key for each: [Red] Your Blood Glucose Reading is higher than the hyperglycemia value [Orange] Your Glucose Reading is between the hypoglycemia value and the highest value of the normal Range [Green] Your Blood Glucose Reading is within the normal Range [Blue] Your Blood Glucose Reading is between the hypoglycemia value and the lowest value of the normal Range [Indigo] Your Blood Glucose Reading is lower than the hypoglycemia value [White] There is an ERROR in the Data4. The Software has 5 different ways to view your Data in Statistical Analysis form: View All Data, Total Analysis Data, Average Value, Standard Deviation, and Coefficient of Variation. Within these Reports, you can choose which time period to view. In the table, you can also view the percentage of each Blood Glucose Reading.5. When analyzing your Data, you can choose which Readings you want it to include. Keep in mind that the unselected Readings will be excluded from ALL calculations and Reports in the Data Analysis and as well as in the Advanced Data Analysis.Data AnalysisNOTEAny Data in the Meter that has an ERROR will be transferred to the database, but will be excluded from allcalculations and analysis.](https://usermanual.wiki/Bionime/GP700/User-Guide-1624888-Page-10.png)
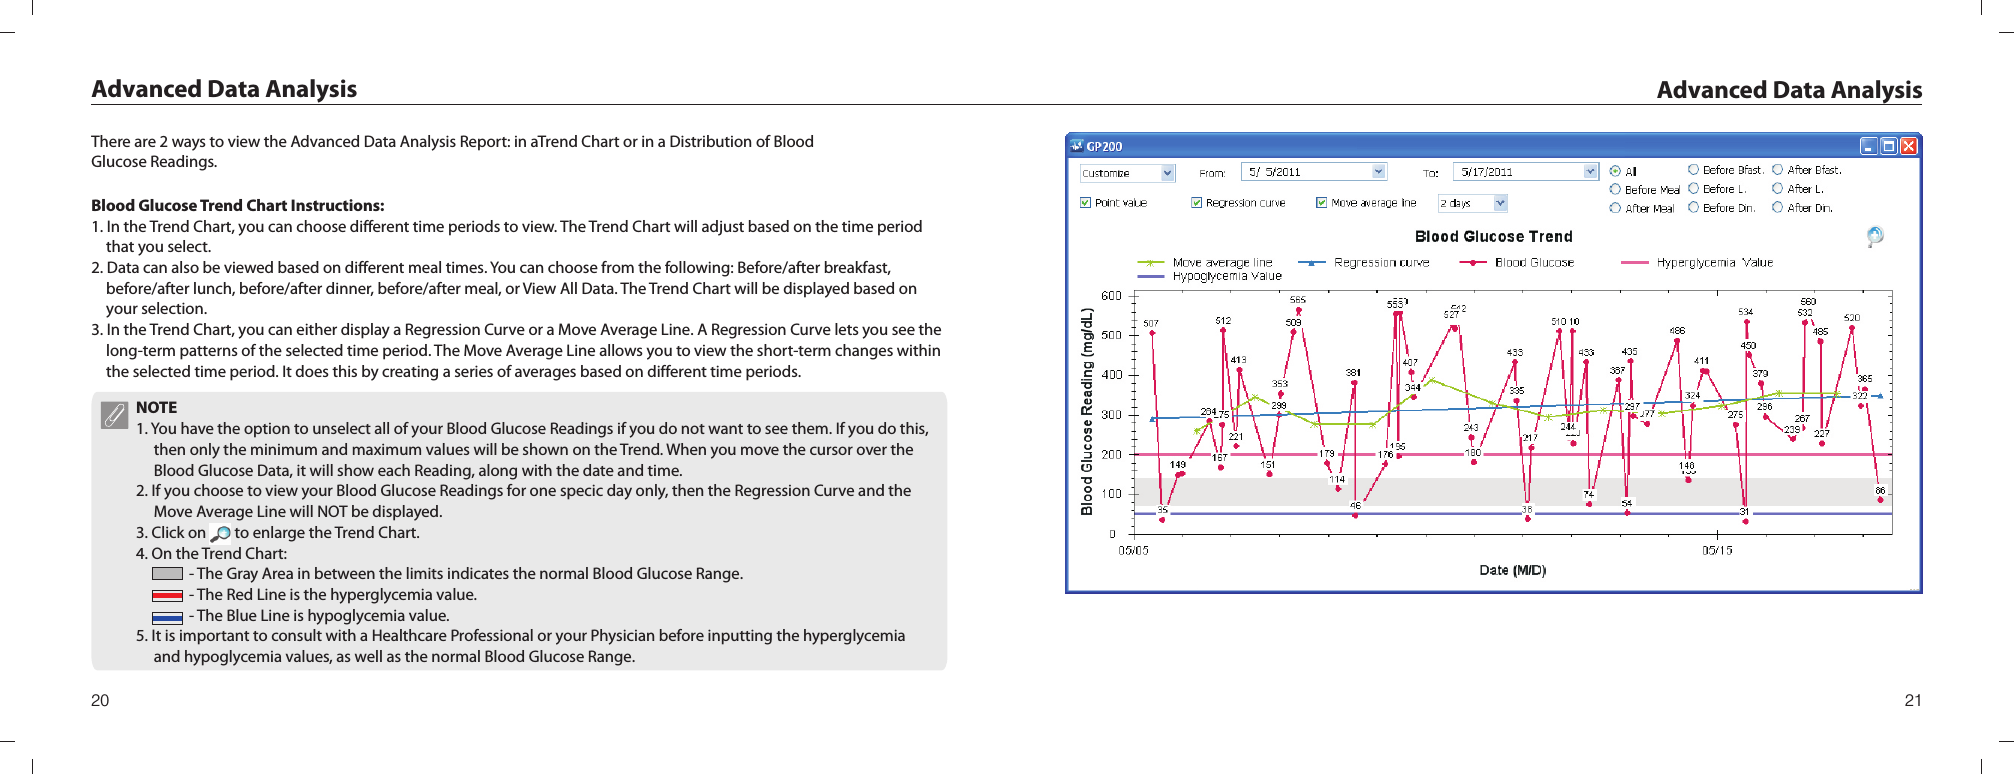
![2322 Instructions for Pie Chart Use:1. You can display certain Blood Glucose Readings by selecting different time periods. The Pie Chart will change based on the time period you choose.2. In the Pie Chart, your Blood Glucose Readings will be represented by dierent colors, based on what the value is. On the following page you will find a COLOR KEY for each value. [Red] Your Blood Glucose Reading is higher than the hyperglycemia value. [Orange] Your Blood Glucose Reading is between the hypeglycemia value and the highest value of the normal range. [Green] Your Blood Glucose Reading is within the normal Range. [Blue] Your Blood Glucose Reading is between the hypoglycemia value and the lowest value of the normal range. [Indigo] Your Blood Glucose Reading is lower than the hypoglycemia value.Advanced Data Analysis (continued)The GP200 Software lets you view your Blood Glucose Readings in many formats, including in a Pie Chart. The visual set up of the Pie Chart can be very helpful in understanding your Blood Glucose Readings better. The only data not available in the Pie Chart is the percentage of each Blood Glucose Reading (like in the Table Format).Advanced Data Analysis (continued)NOTE1. Any errors within the data will NOT be included in the Pie Chart.2. Be sure to contact your Physician or a Healthcare Professional BEFORE you input the hyperglycemia and hypoglycemia values.](https://usermanual.wiki/Bionime/GP700/User-Guide-1624888-Page-12.png)