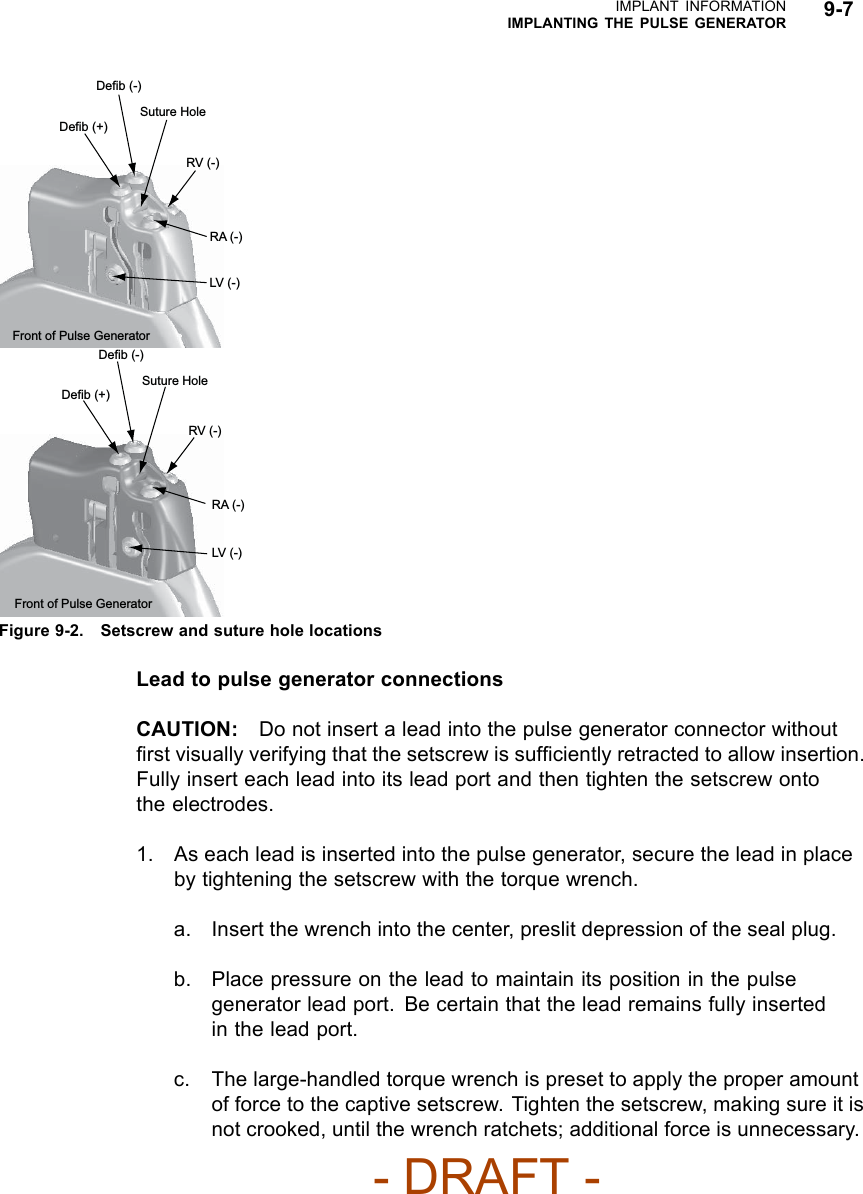
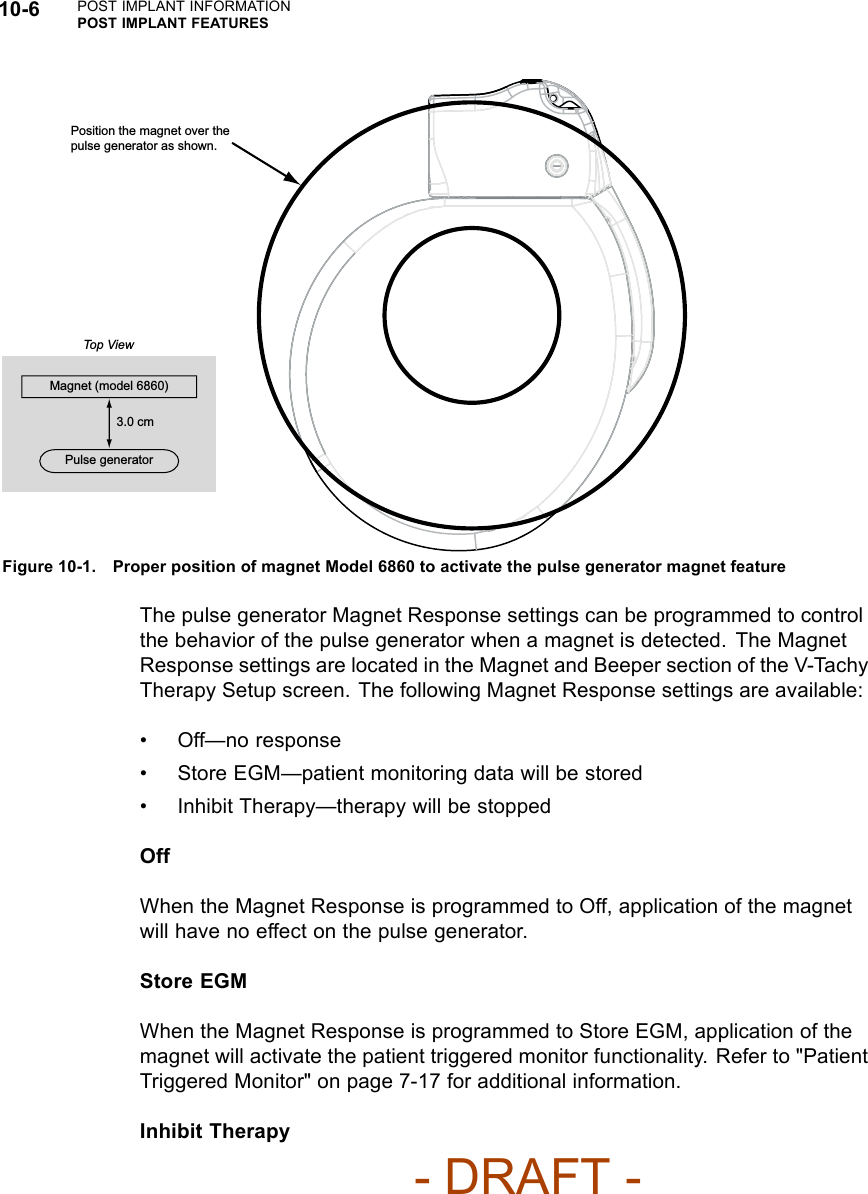
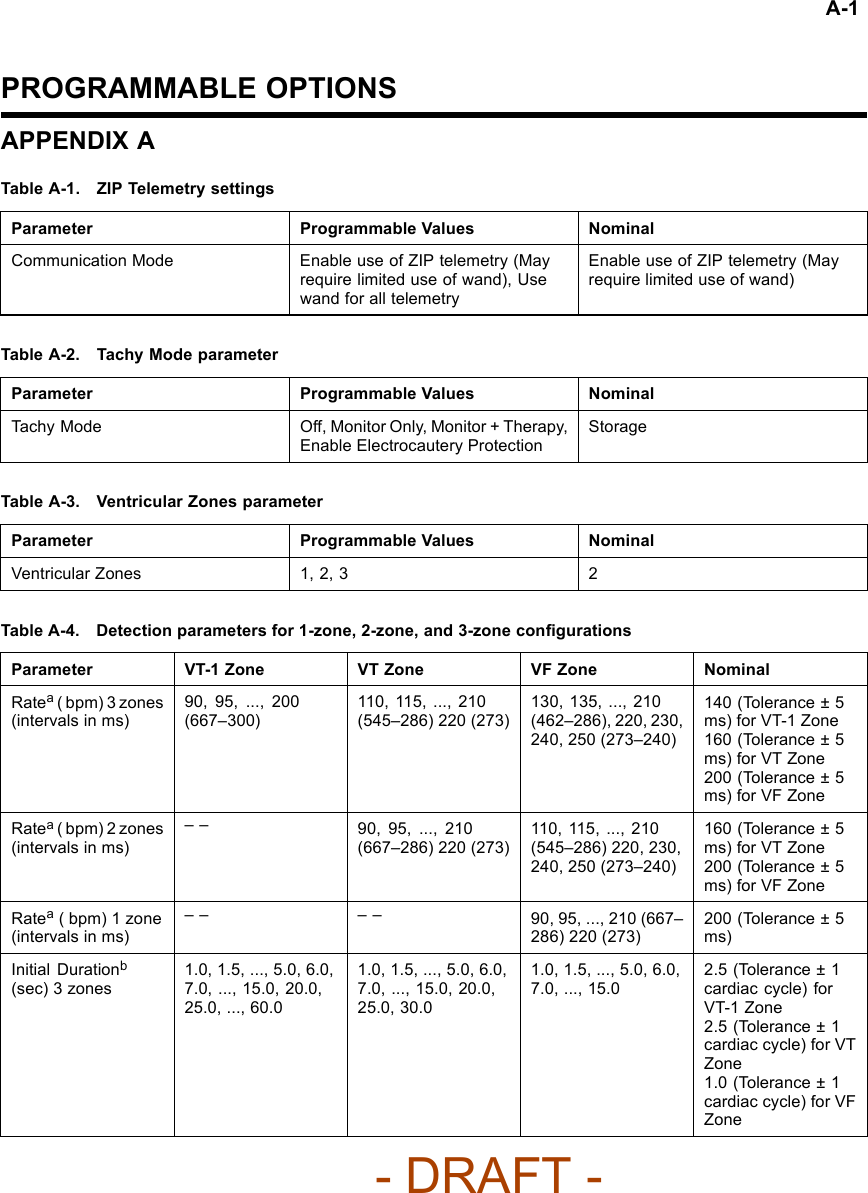
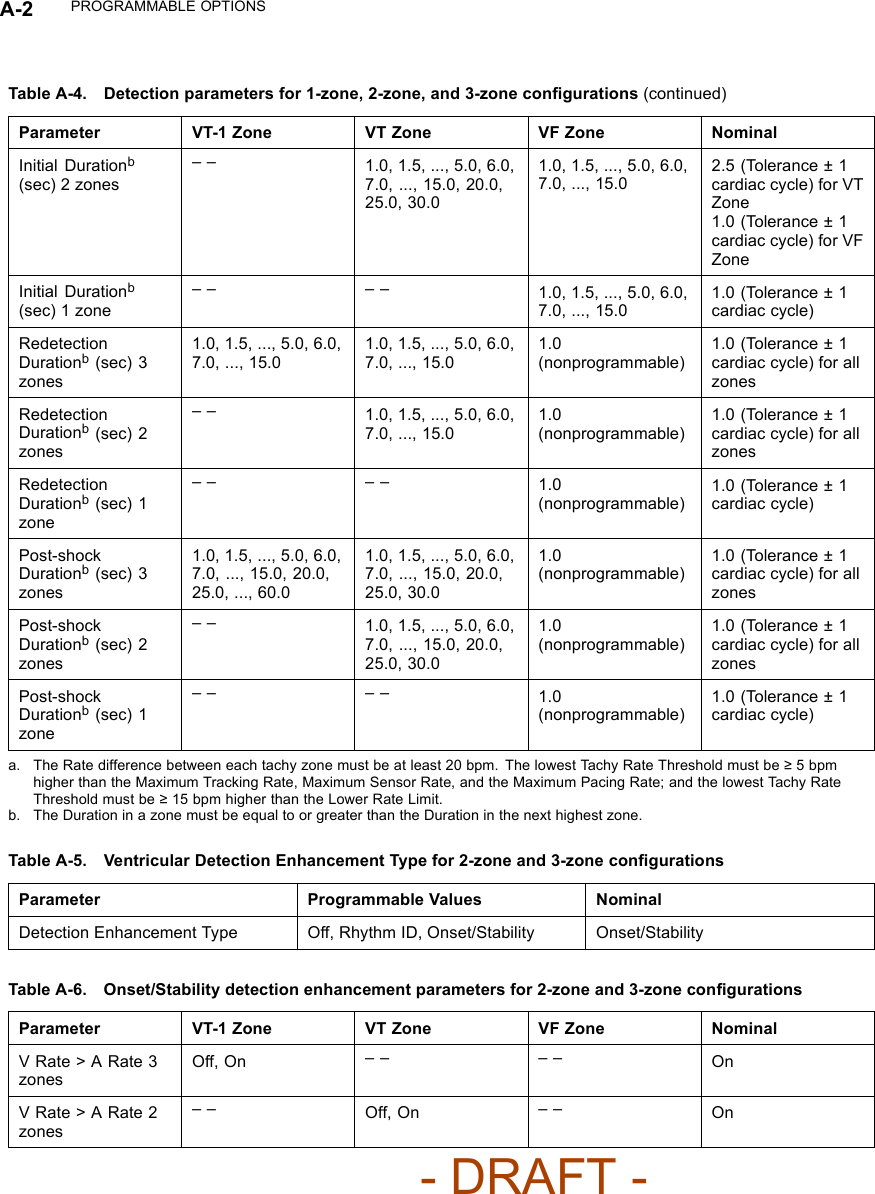
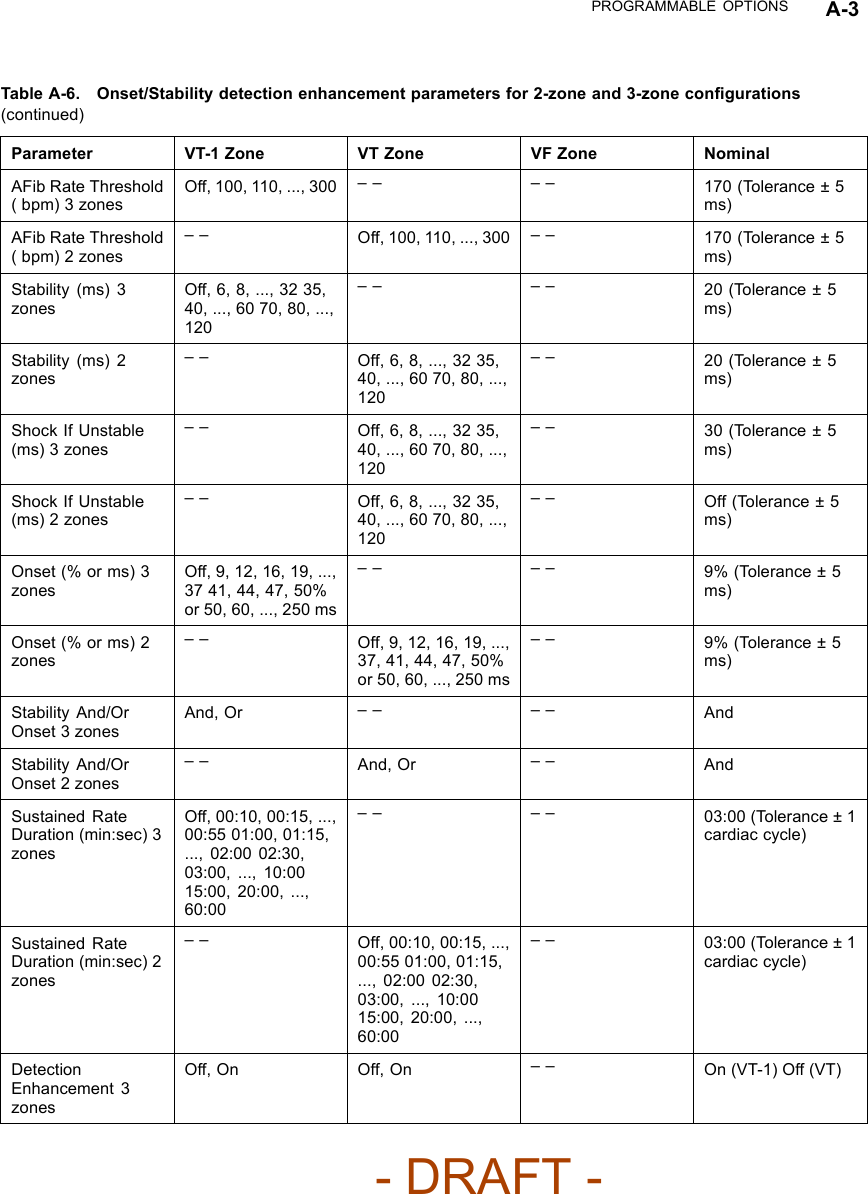
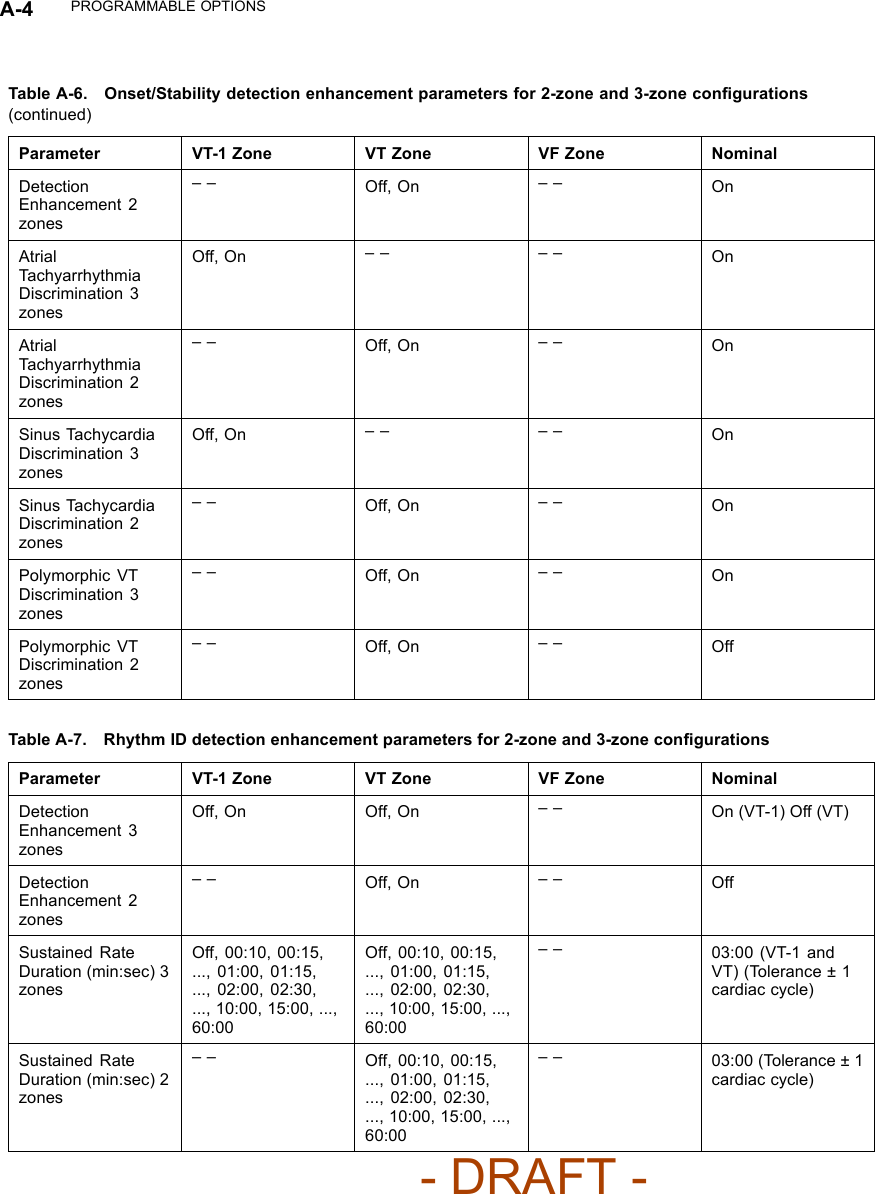
Boston Scientific CRMN11906 Implantable Defibrillator User Manual Cognis Part 3 Manual
Boston Scientific Corporation Implantable Defibrillator Cognis Part 3 Manual
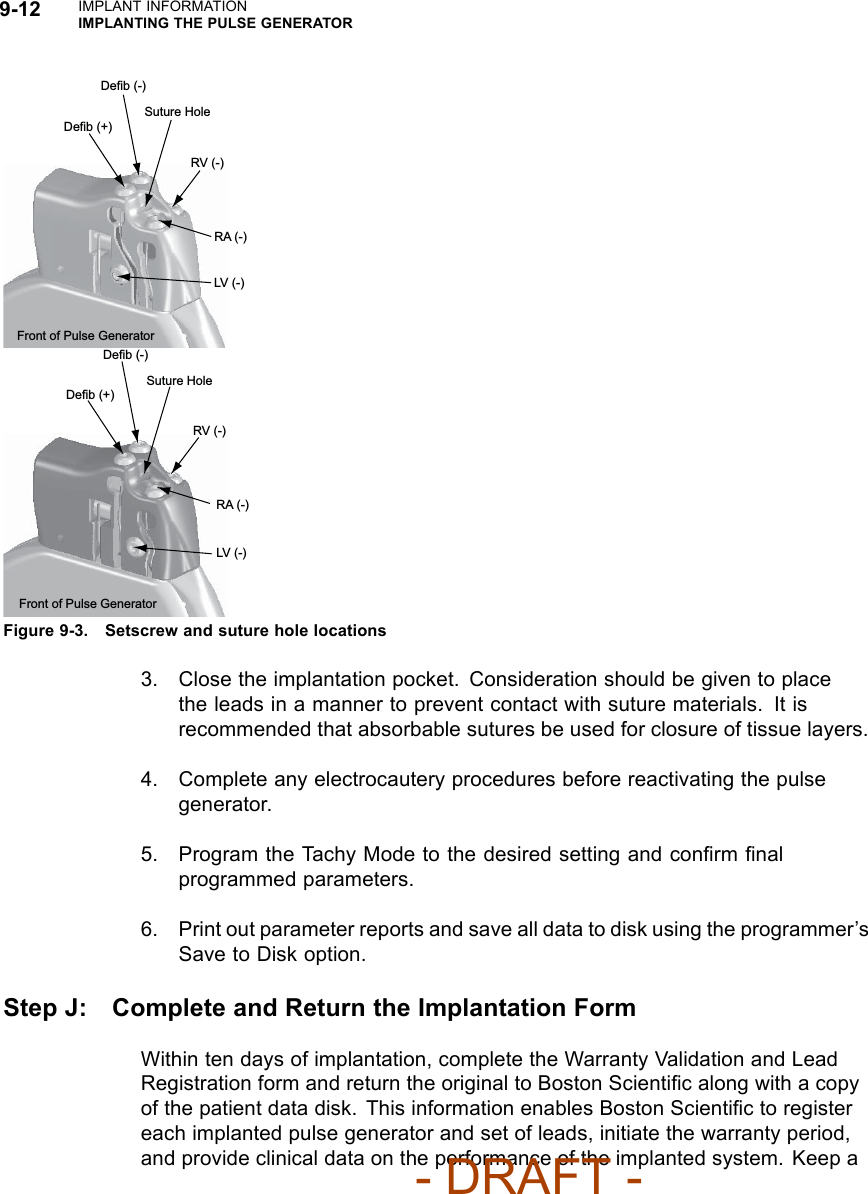
UserManual.wiki
>
Boston Scientific
>
CRMN11906 User Manual
>
Cognis Part 3 Manual
Contents
1.
Cognis Part 1 Manual
2.
Cognis Part 2 Manual - fccid
3.
Cognis Part 3 Manual
4.
Cognis Part 4 Manual
5.
Teligen Part 1 Manual
6.
Part 2 Teligen Manual
Cognis Part 3 Manual
Navigation menu
Upload a User Manual
Namespaces
Wiki Guide
HTML
PDF
Info
Views
User Manual
Discussion / Help
Navigation


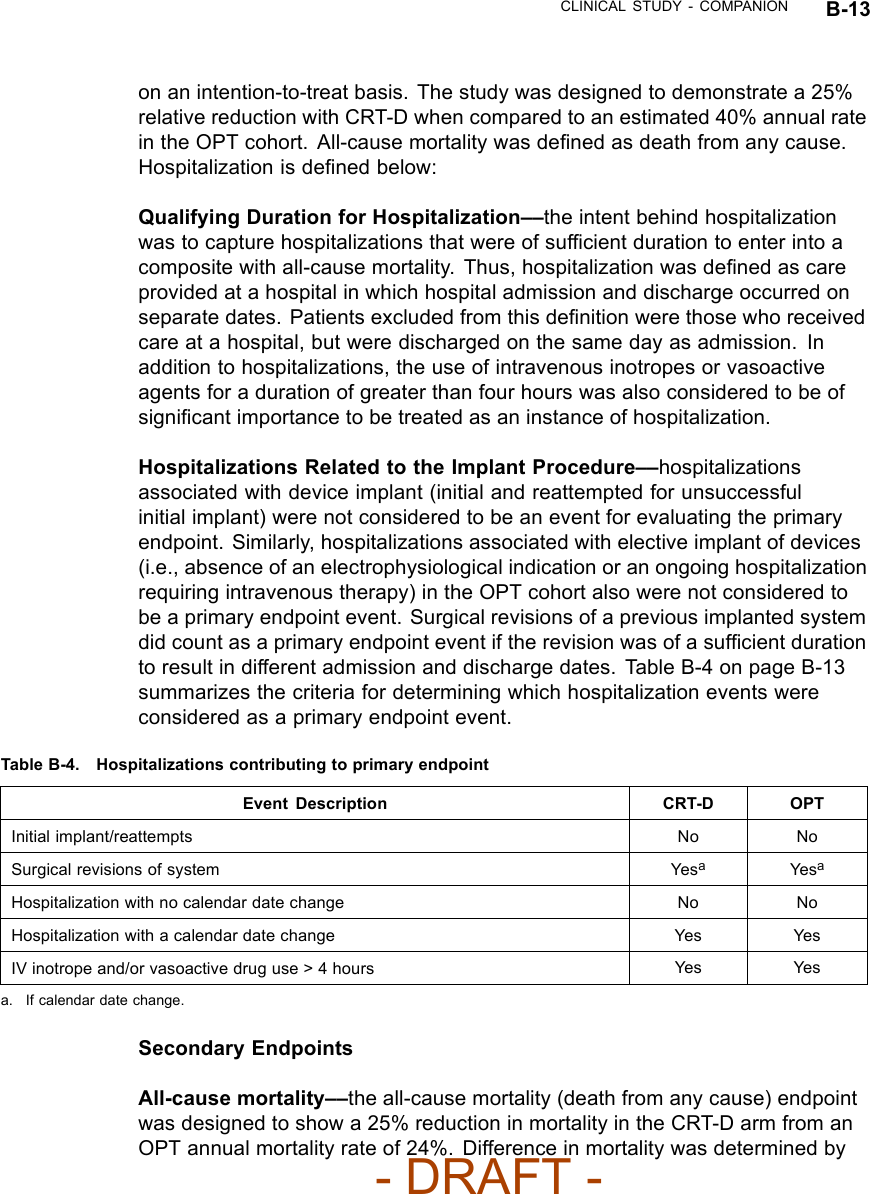
![CLINICAL STUDY - COMPANION B-9Table B-3. CRT-D and OPT cause of death (continued)Cause of Death OPT Arm(N = 308)CRT-D Arm(N = 595)Total(N = 903)Unknown/ Unclassified 8 (2.6%) 5 (0.8%) 13 (1.4%)Total Deaths 77 (25.0%) 105 (17.6%) 182 (20.2%)NOTE: After the study was stopped in November 2002, follow-up for safetycontinued for approximately one more year on 151 OPT and 449 CRT-Dpatients with the final data cut-off on November 26, 2003. During this post-trialfollow-up period, an additional 54 deaths were reported, consisting of 14/151(9.3%) OPT patients and 40/449 (8.9%) CRT-D patients.The mortality rates are approximately equal during this post-trial follow-upperiod. This may be because CRT devices were made available to OPTpatients. Thus, most patients were receiving the same therapy during thisinterval.STUDY DESIGNThe COMPANION study design and study results have been previouslydescribed in the medical literature.12The COMPANION study was a prospective, randomized (1:2:2 to OPT, CRT-P[delivered by the CONTAK TR device], or CRT-D [delivered by the CONTAKCD device]), controlled, multi-center study. Both of these devices becamecommercially available during the course of the study.Randomization was stratified by centers and by beta-blocker use toassure proper balance between the treatment groups within each center.Each randomized patient remained counted as a member of the originalrandomization assignment (intention-to-treat) regardless of subsequentcrossover or protocol adherence.Eligible patients were also enrolled in a sub-study designed to measureimprovement in exercise performance in patients randomized to CRT (CRT-Pand CRT-D pooled data) therapy compared to OPT.1. Bristow MR, Feldman AM, Saxon LA. Heart failure management using implantable devices forventricular resynchronization: Comparison of Medical Therapy, Pacing, and Defibrillation inChronic Heart Failure (COMPANION) trial. J Card Fail. 2000;6(3):276-285.2. Bristow MR, Saxon LA, Boehmer J, et al. Cardiac resynchronization therapy with or without animplantable defibrillator in advanced chronic heart failure. N Engl J Med. 2004;350:2140-2150.- DRAFT -](https://usermanual.wiki/Boston-Scientific/CRMN11906.Cognis-Part-3-Manual/User-Guide-886098-Page-95.png)
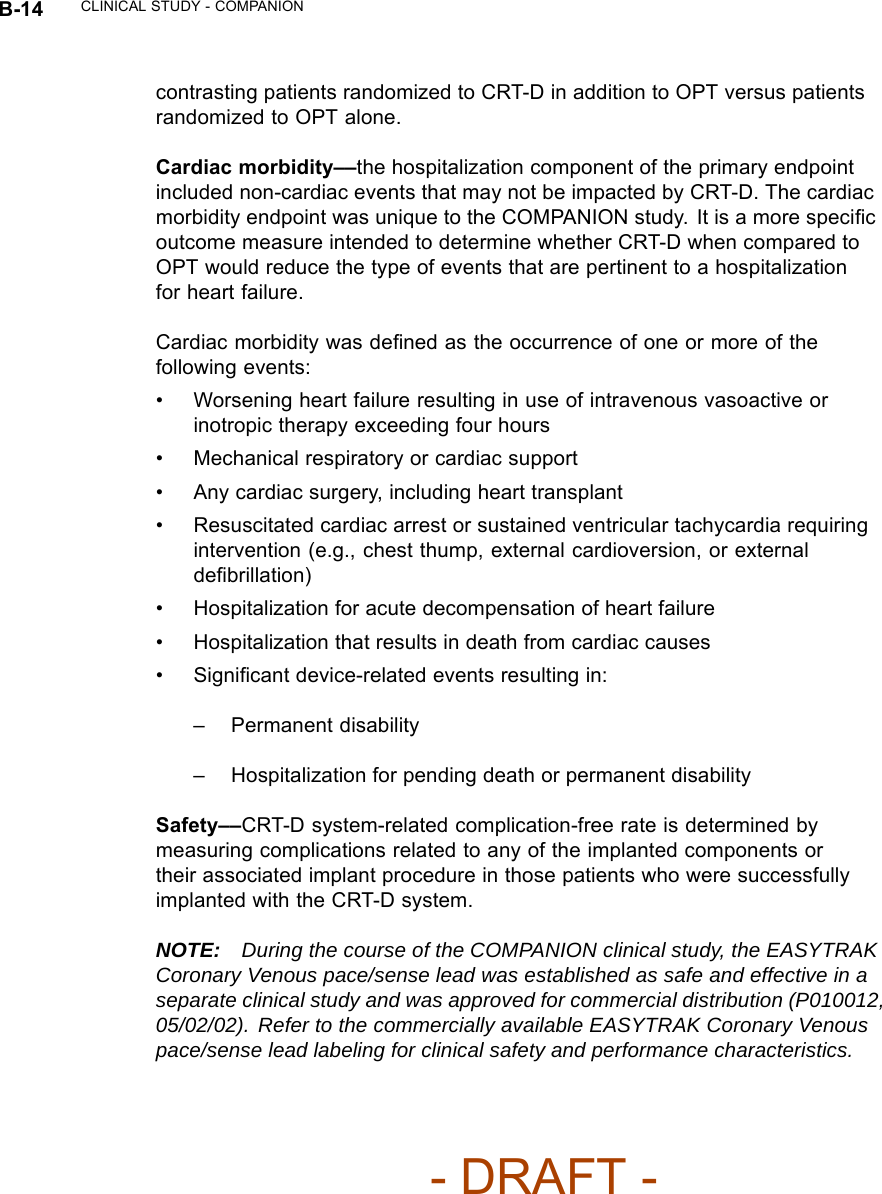
![B-10 CLINICAL STUDY - COMPANIONINCLUSION/EXCLUSION CRITERIAThe study population consisted of patients with moderate to severe heartfailure, New York Heart Association Classification III or IV, left ventricularejection fraction ≤35%, and QRS width ≥120 ms due to ischemic ornon-ischemic cardiomyopathy.All patients were required to have been treated with a stable dose ofbeta-blocker, ACE inhibitor or ARB, diuretic, and aldosterone antagonist. Astable dose was defined as 30 days for all drugs except beta-blocker, whichrequired 90 days stabilization from last up titration prior to randomization.Diuretic dosage could be adjusted any time by the investigator using medicaldiscretion.Patients enrolled in the study were required to meet the following inclusioncriteria:• Moderate or severe heart failure, defined as symptomatic heart failurefor at least six months with NYHA class III or IV symptoms at the time ofenrollment, and at least one of the following events in the previous 12months:– Hospitalization for heart failure management– Outpatient visit in which intravenous (IV) inotropes or vasoactiveinfusion were administered continuously for at least 4 hours– Emergency room visit of at least twelve hours duration in which IVheart failure medications were administered (including diuretics)•QRS≥120 ms and PR interval > 150 ms from any two leads of a 12–leadECG• Left ventricular ejection fraction ≤35%• Left ventricular end diastolic dimension ≥60 mm (required only if LVEFmeasured by echo) or > 3.0 cm/m2(The cm/m2is calculated by LVEDD [incm] divided by BSA [body surface area])•Age≥18 years• Optimal pharmacologic therapy for heart failure (beta blocker, ACE inhibitor,diuretics, and spironolactone)- DRAFT -](https://usermanual.wiki/Boston-Scientific/CRMN11906.Cognis-Part-3-Manual/User-Guide-886098-Page-96.png)