Boston Scientific CRMN11906 Implantable Defibrillator User Manual Cognis Part 4 Manual
Boston Scientific Corporation Implantable Defibrillator Cognis Part 4 Manual
UserManual.wiki
>
Boston Scientific
>
CRMN11906 User Manual
>
Cognis Part 4 Manual
Contents
1.
Cognis Part 1 Manual
2.
Cognis Part 2 Manual - fccid
3.
Cognis Part 3 Manual
4.
Cognis Part 4 Manual
5.
Teligen Part 1 Manual
6.
Part 2 Teligen Manual
Cognis Part 4 Manual
Navigation menu
Upload a User Manual
Namespaces
Wiki Guide
HTML
PDF
Info
Views
User Manual
Discussion / Help
Navigation
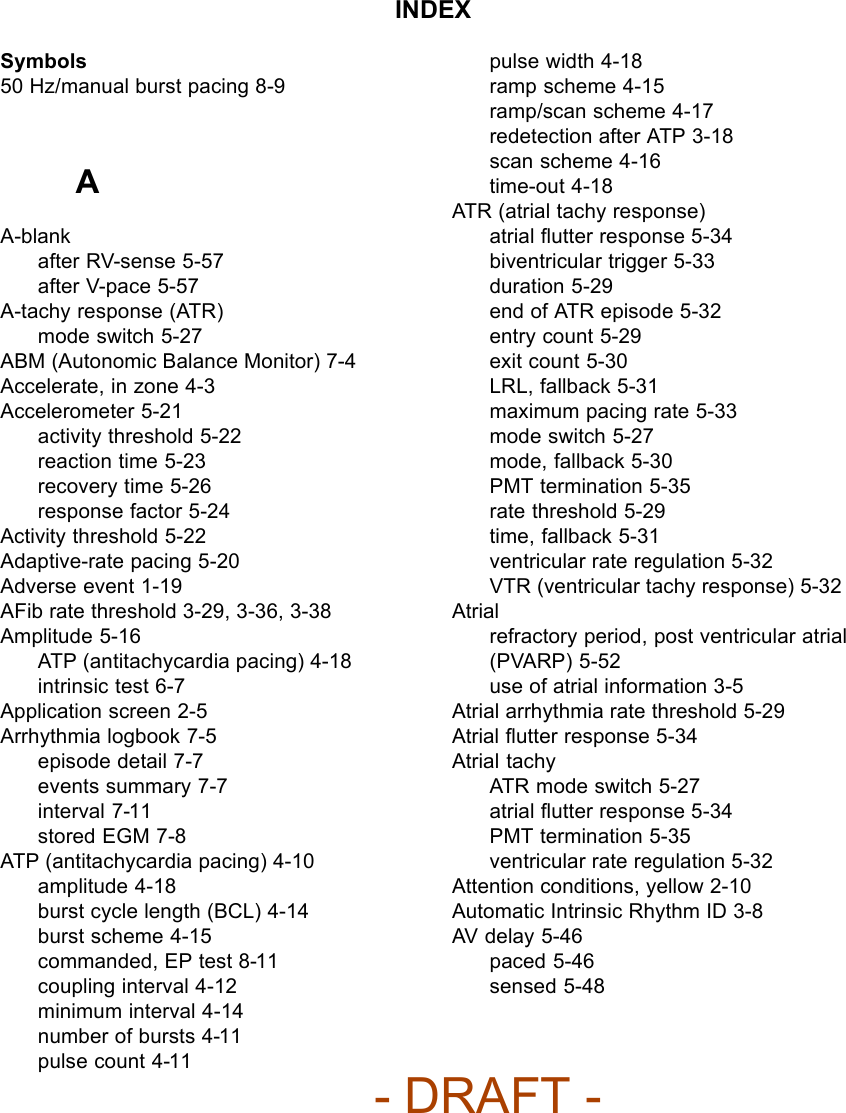
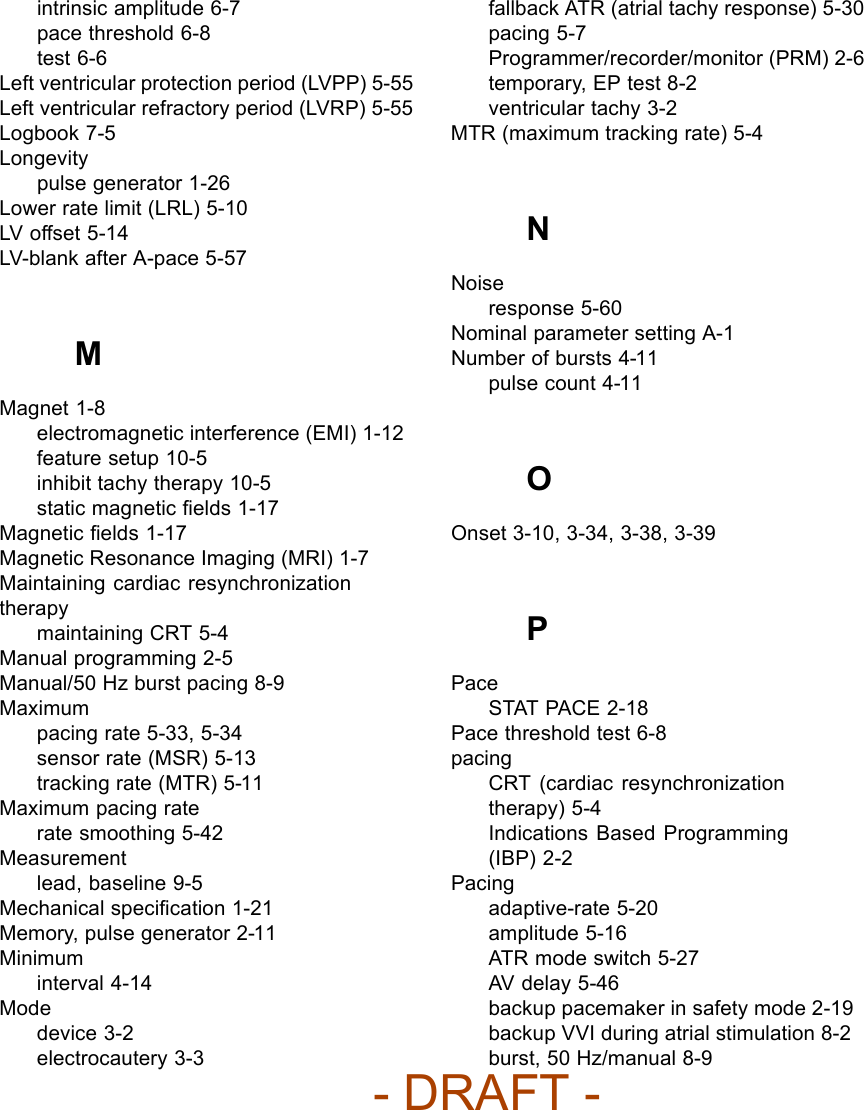
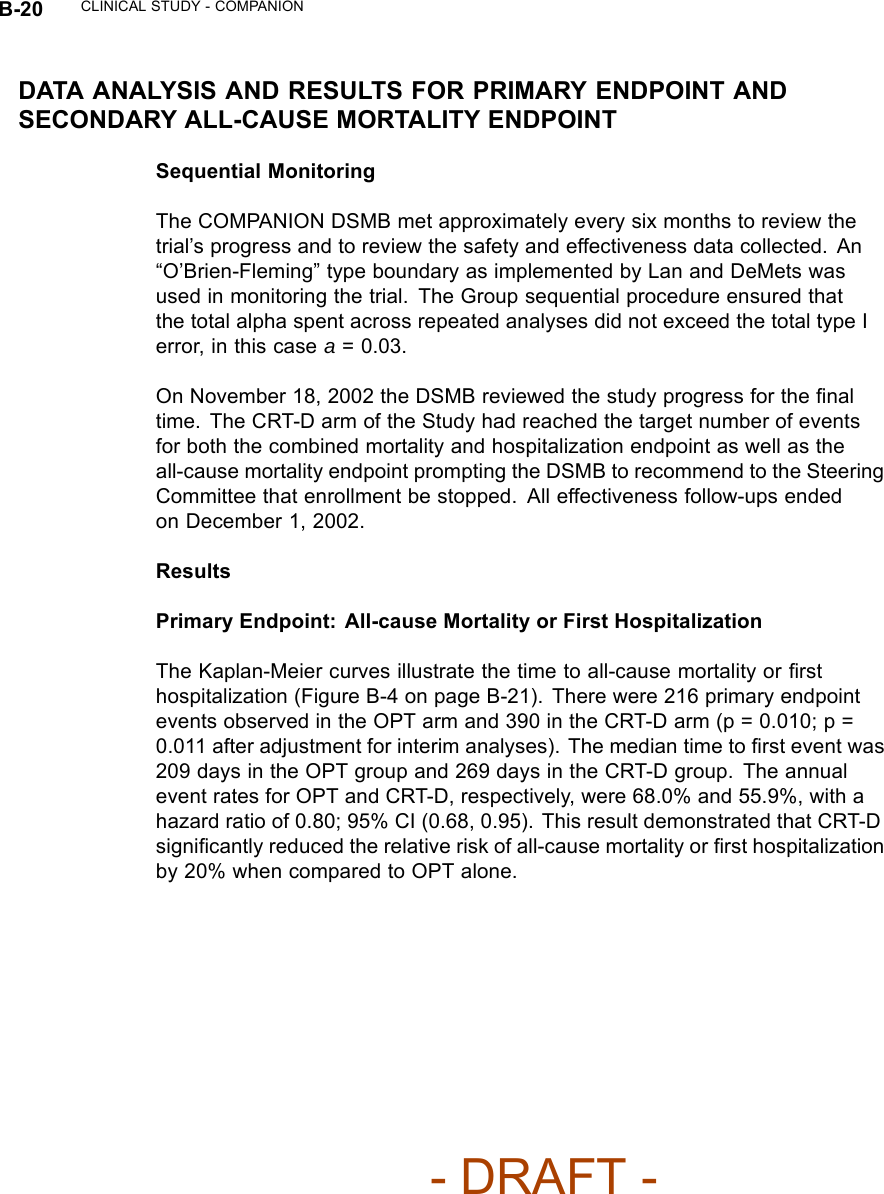
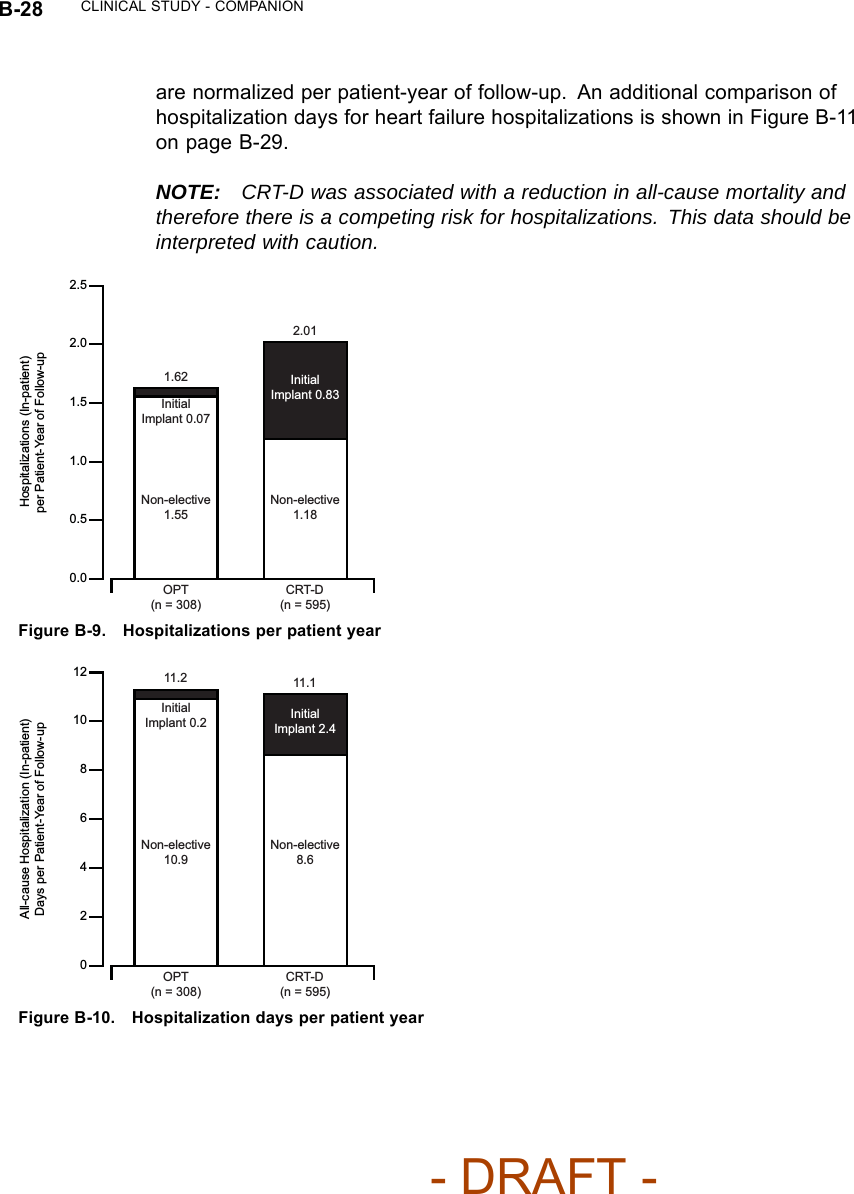
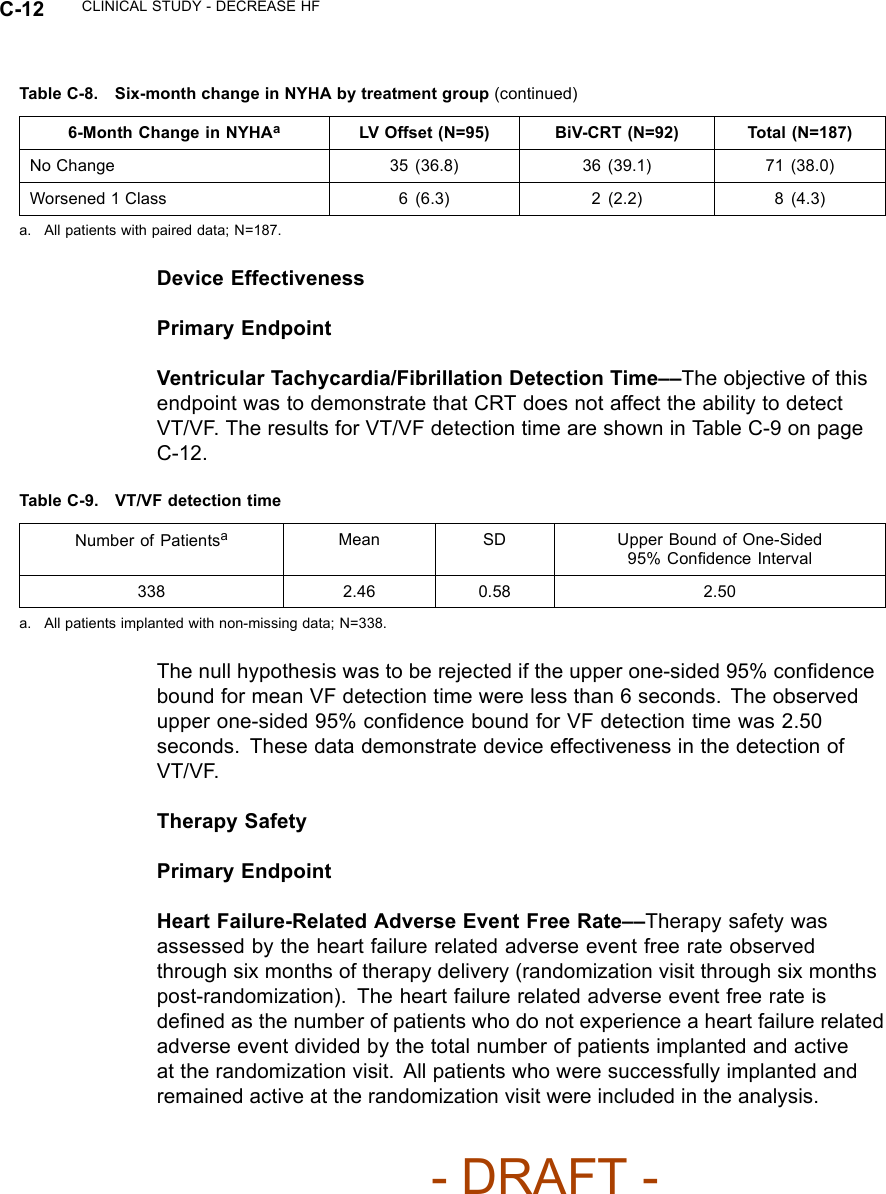
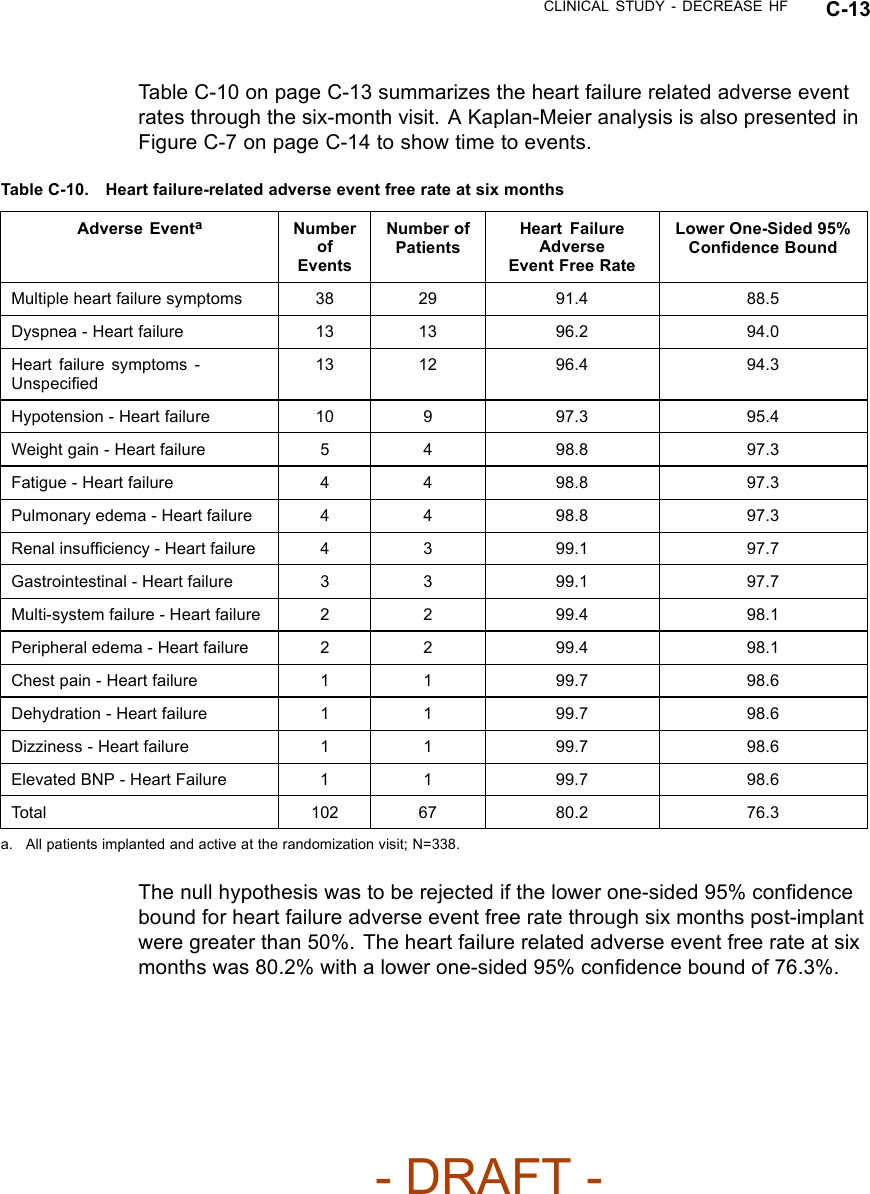
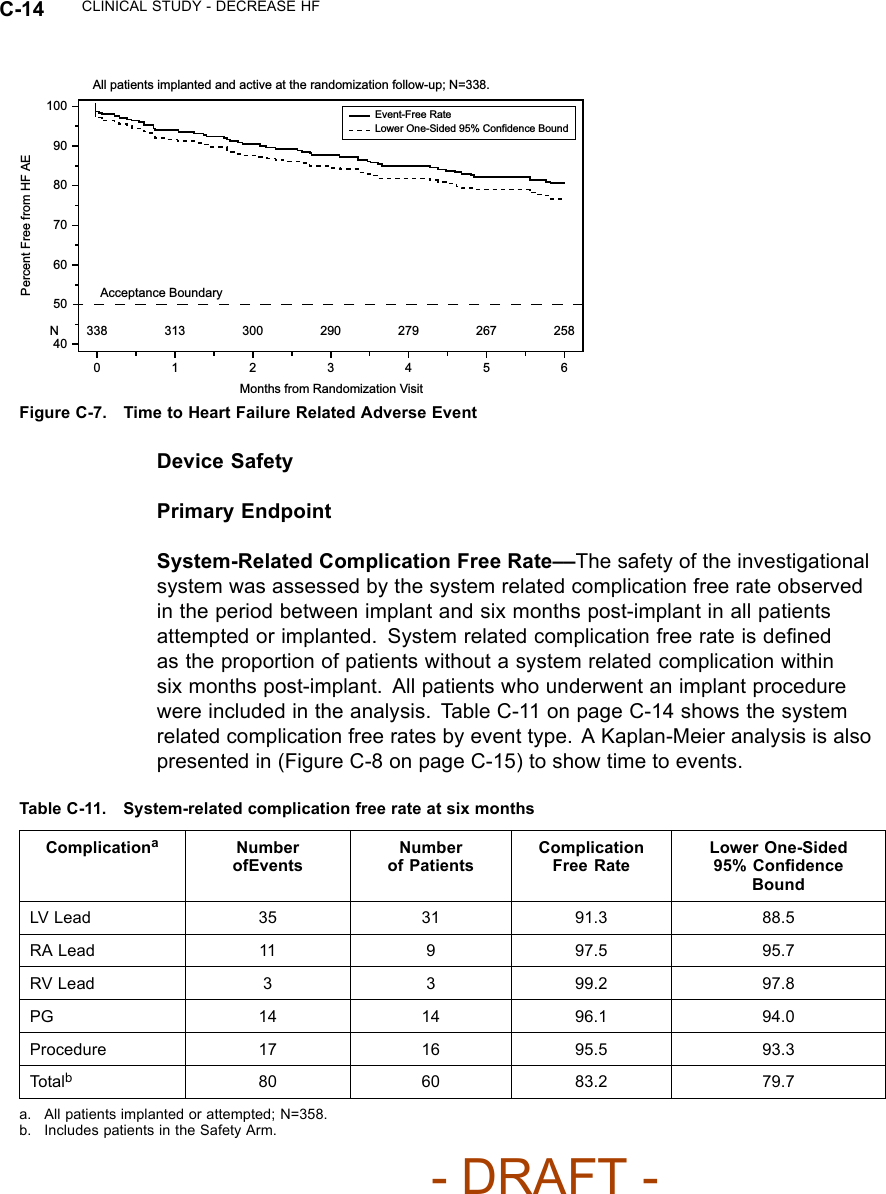
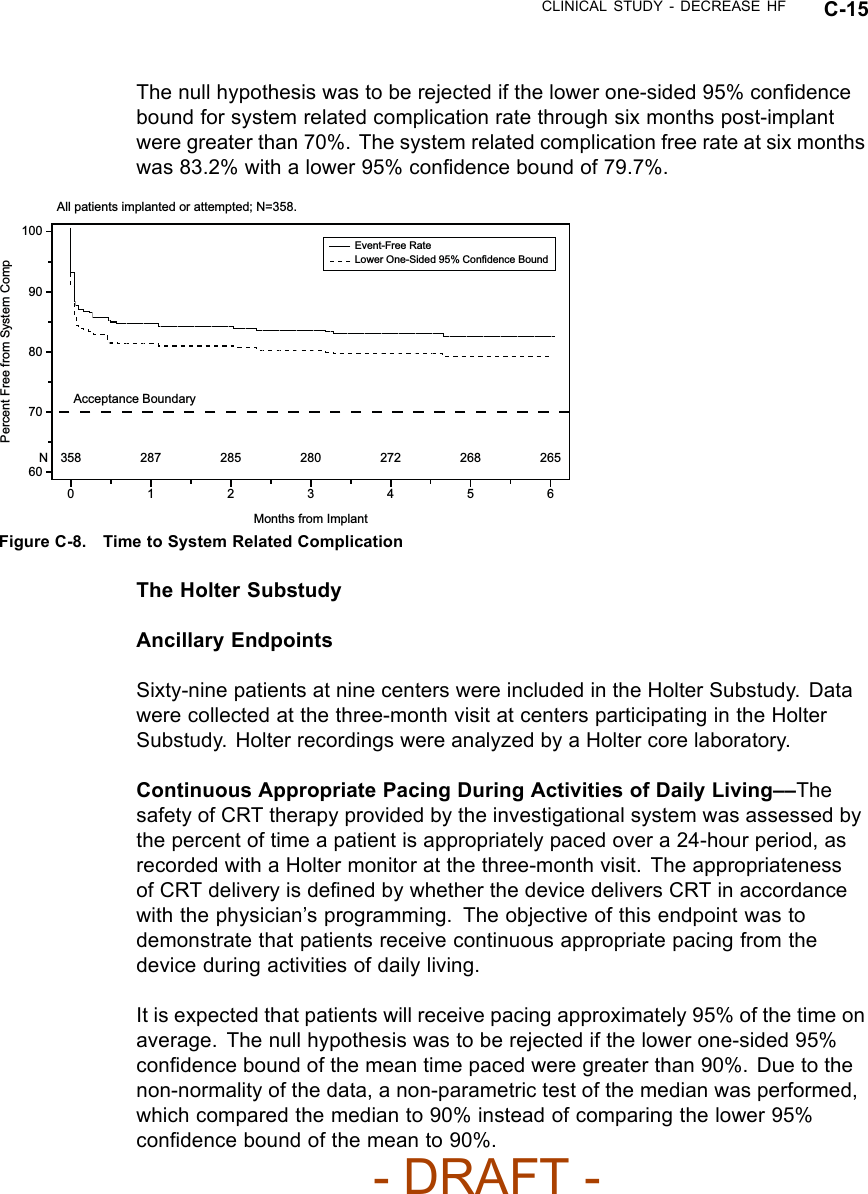
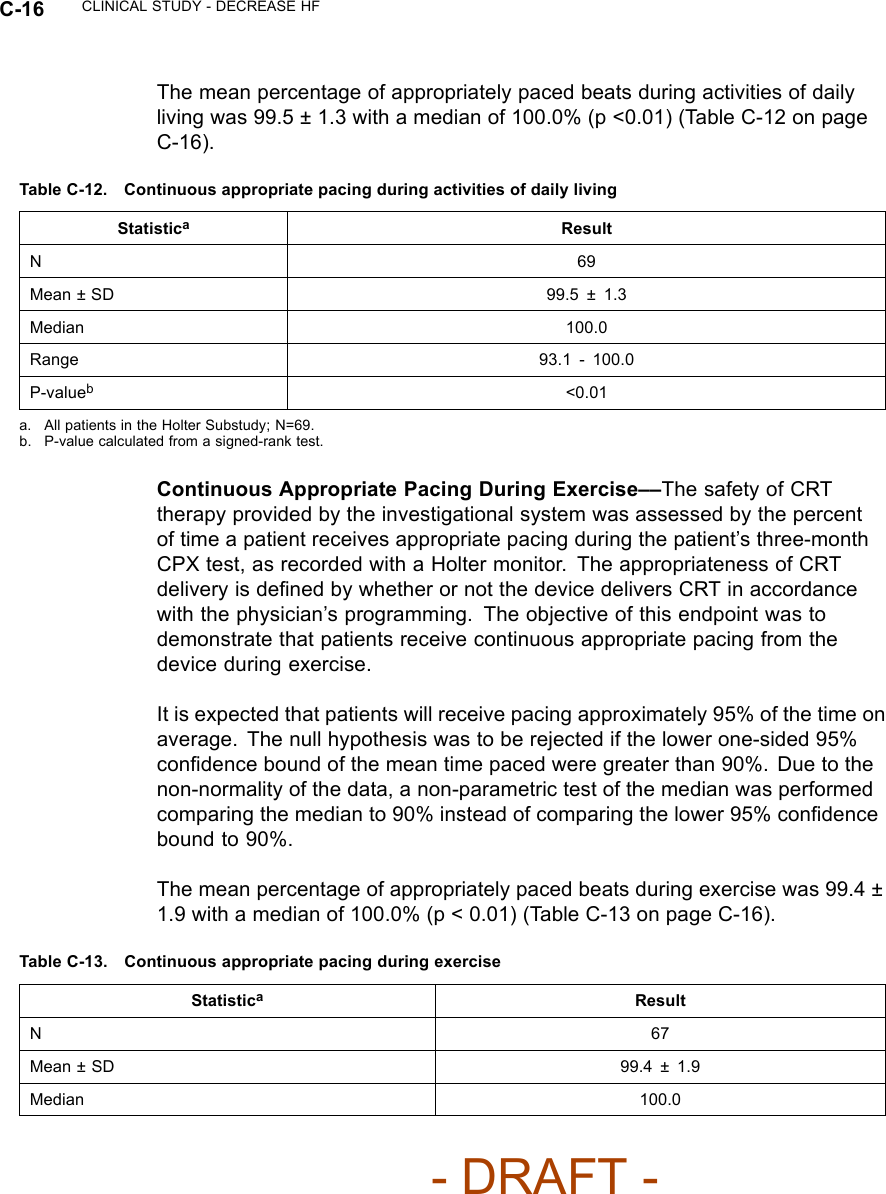
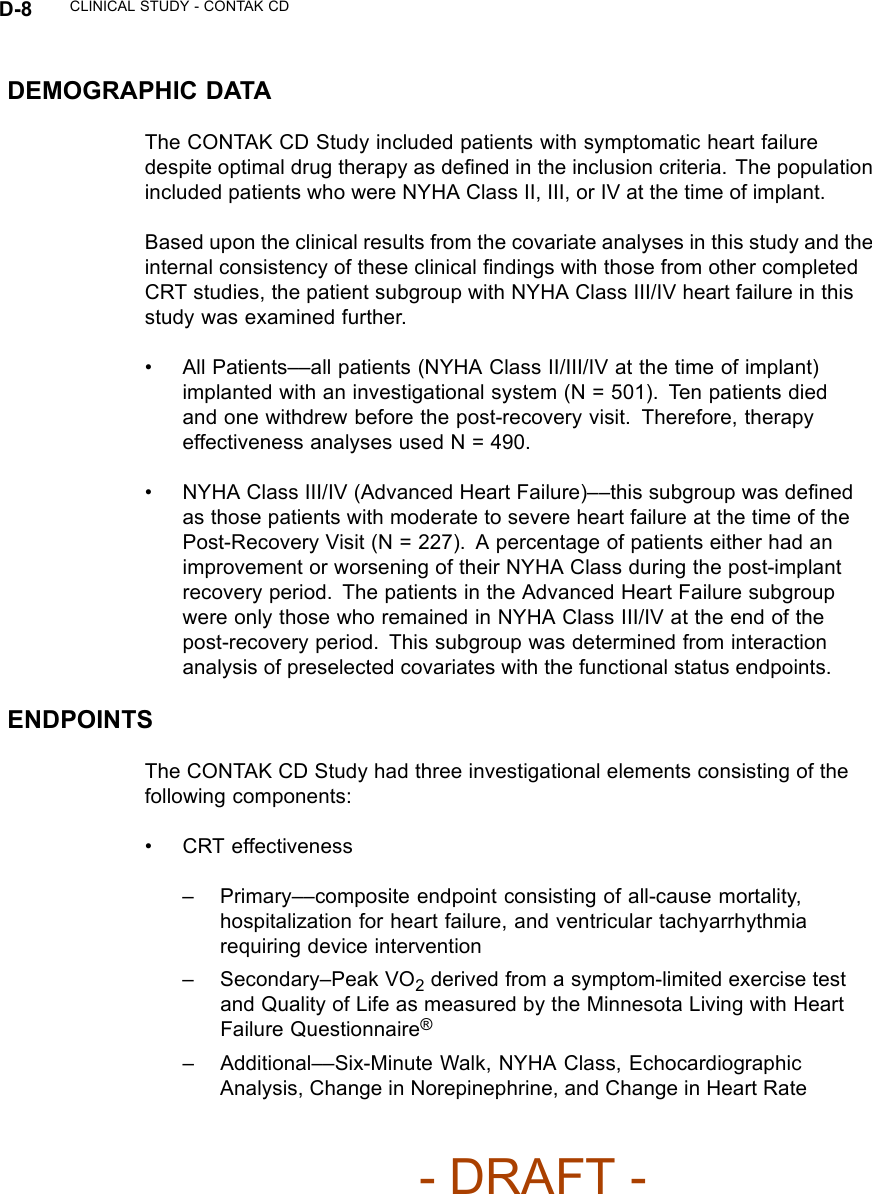
![CLINICAL STUDY - COMPANION B-15Sub-study Primary Endpoint and Additional Tertiary EndpointsExercise performance––the co-primary endpoint, which consists of Peak VO2and Six-Minute Walk, is designed to demonstrate improvement in exerciseperformance with CRT (CONTAK TR and CONTAK CD pooled data) comparedto OPT at six months post-baseline.Additional tertiary endpoints included Quality of Life as measured by theMinnesota Living with Heart Failure Questionnaire®and NYHA Class.FOLLOW-UP SCHEDULEThe follow-up schedule included the following:• Enrollment––initial assessment of patient eligibility; taking of patient history• Baseline screening––special testing (included a Symptom-Limited TreadmillTest with measurement of oxygen uptake (Peak VO2), a Six-Minute Walk,Quality of Life [QOL] questionnaire and NYHA Classification)• Randomization––randomization status (OPT, CRT-P, or CRT-D) wasassigned• Implant (CRT-P or CRT-D arm)––implant of investigational devices andacute device testing for those randomized to a CRT therapy arm• Routine follow-up––routine evaluation of device function and patientcondition at pre-discharge, one week, and one month post-implant• Three- and six-month visits––evaluation of randomized therapy with specialtesting and device function at three and six months after the Post-RecoveryVisit• Quarterly Visits––after the six-month visit, patients were seen for routineevaluation of device function and patient conditionDEMOGRAPHIC DATAAll baseline patient characteristics are presented in Table B-5 on page B-16.- DRAFT -](https://usermanual.wiki/Boston-Scientific/CRMN11906.Cognis-Part-4-Manual/User-Guide-886099-Page-1.png)
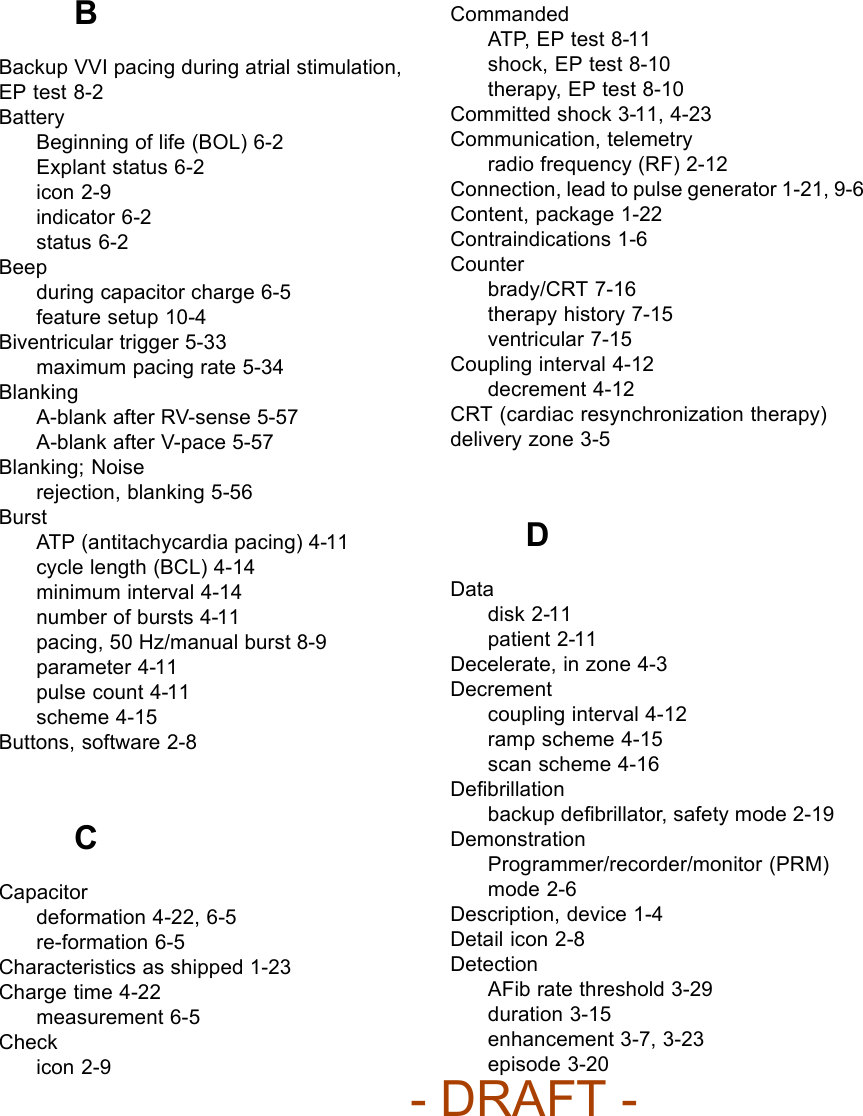
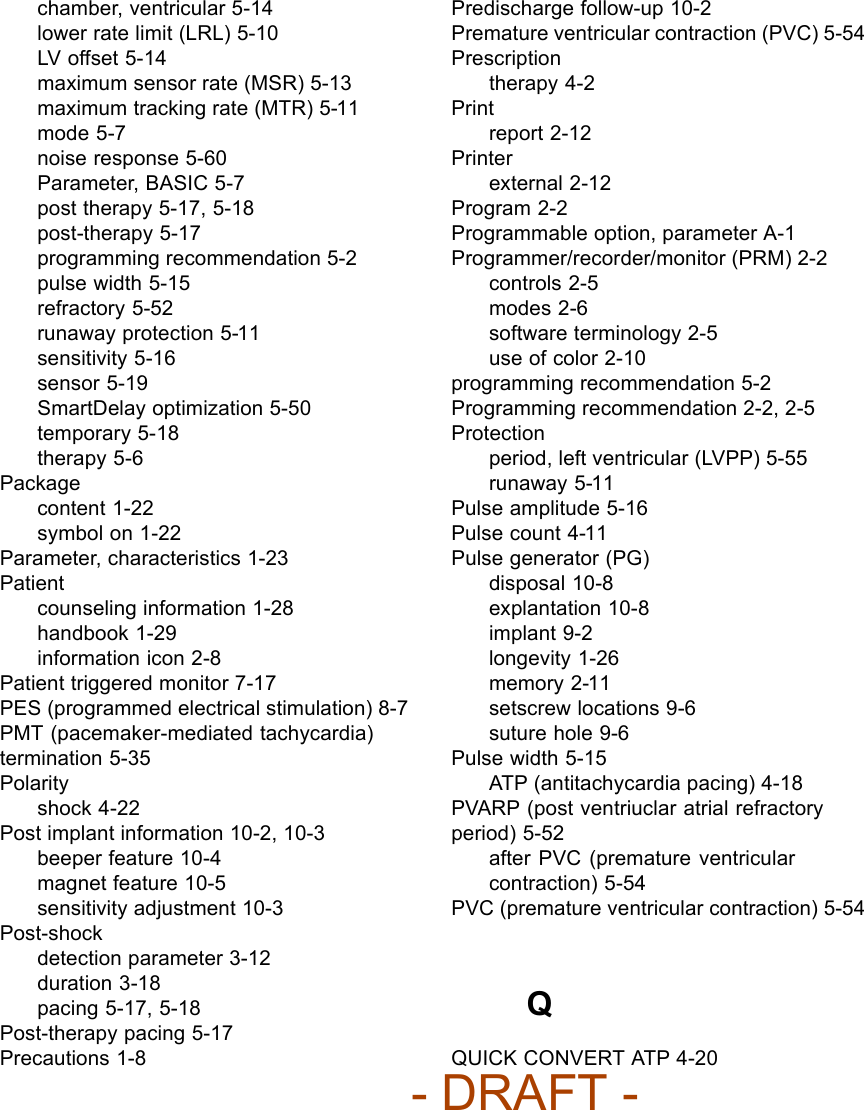
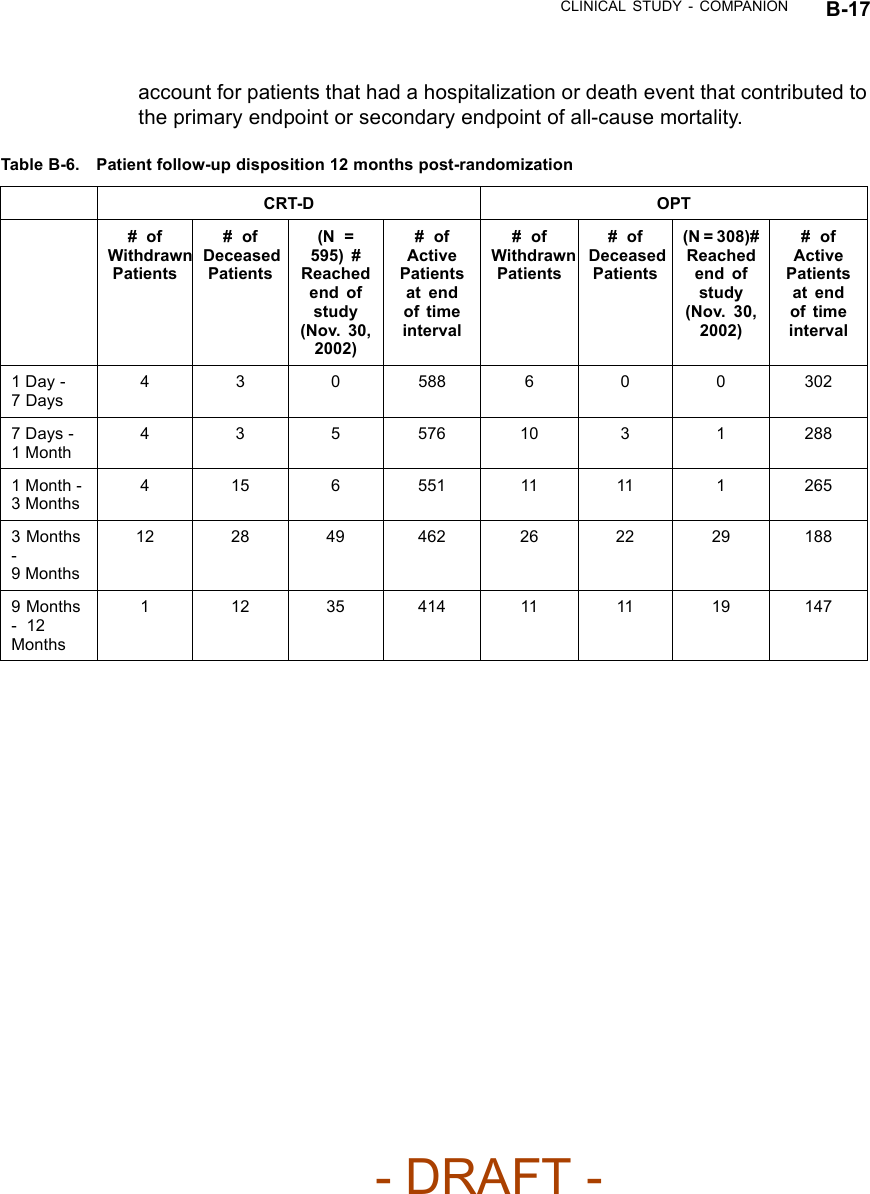
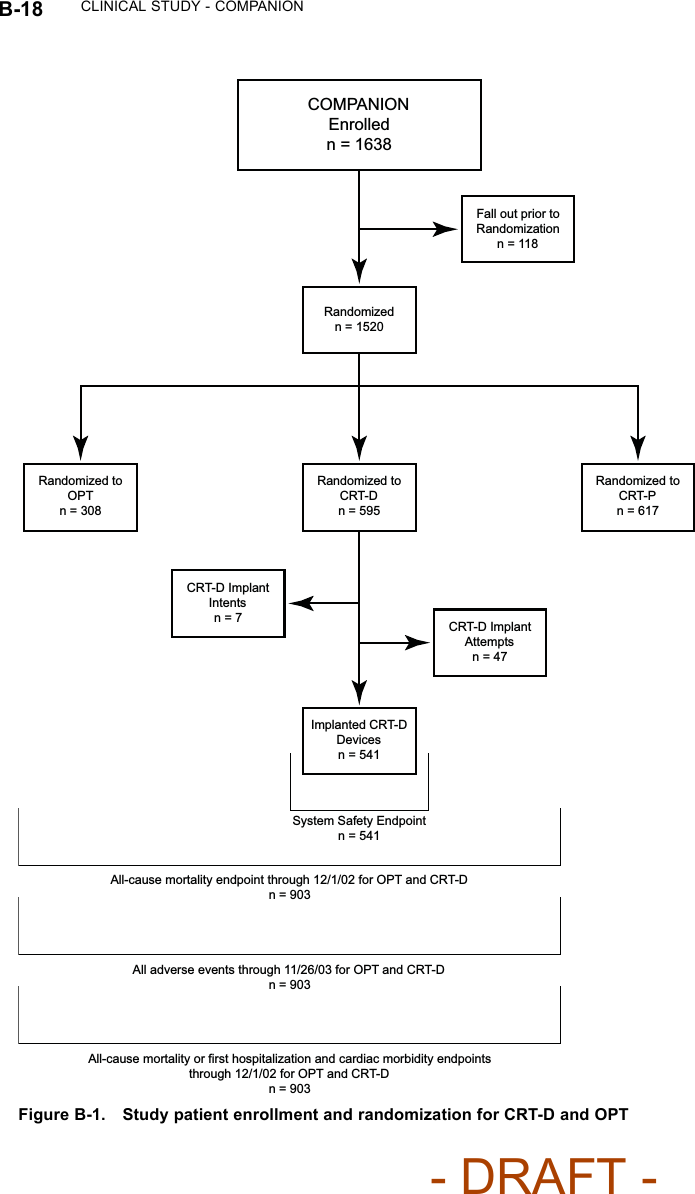
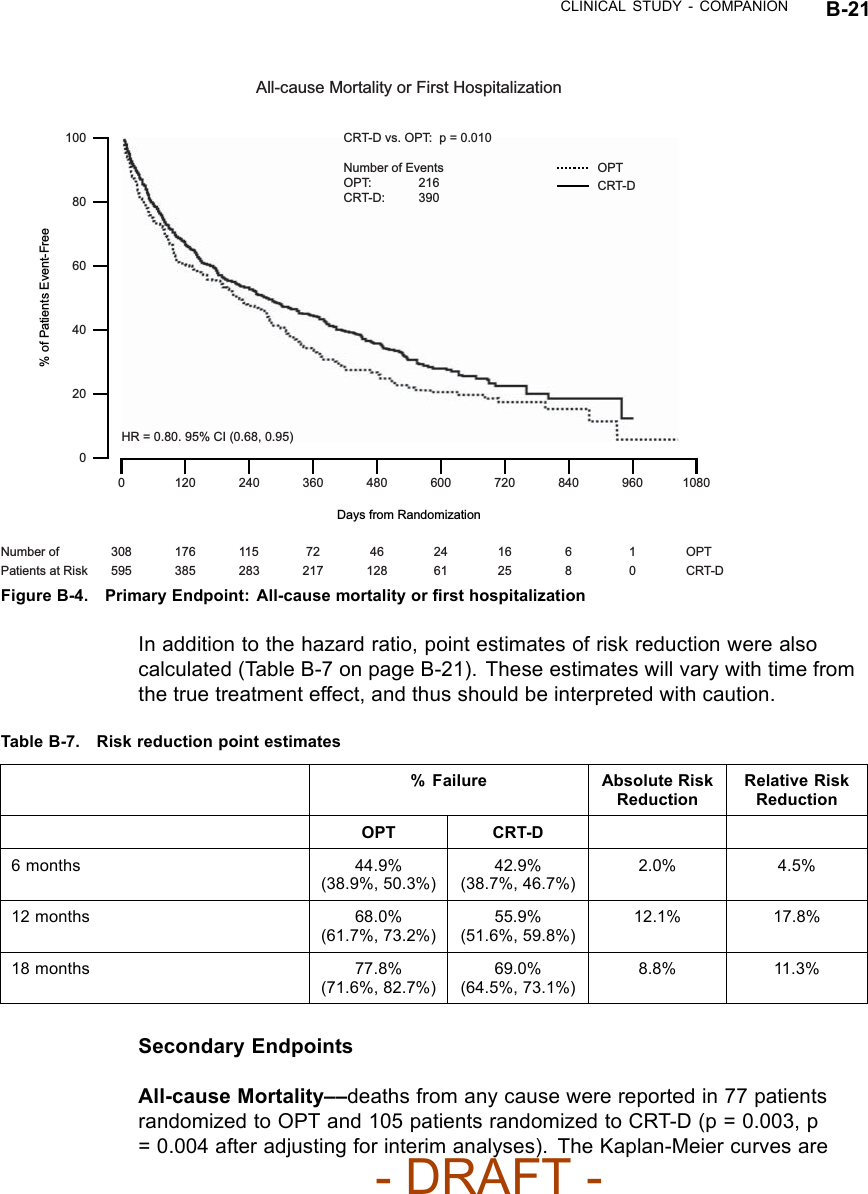
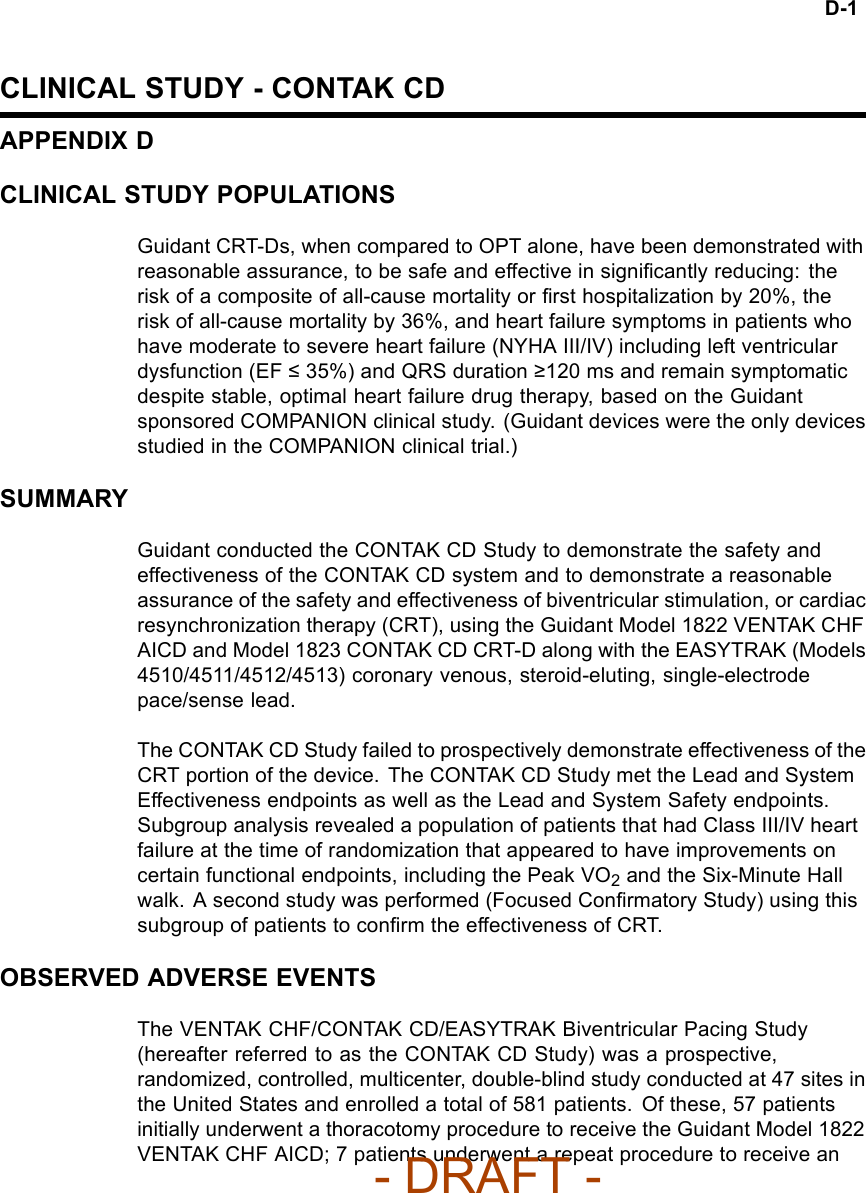
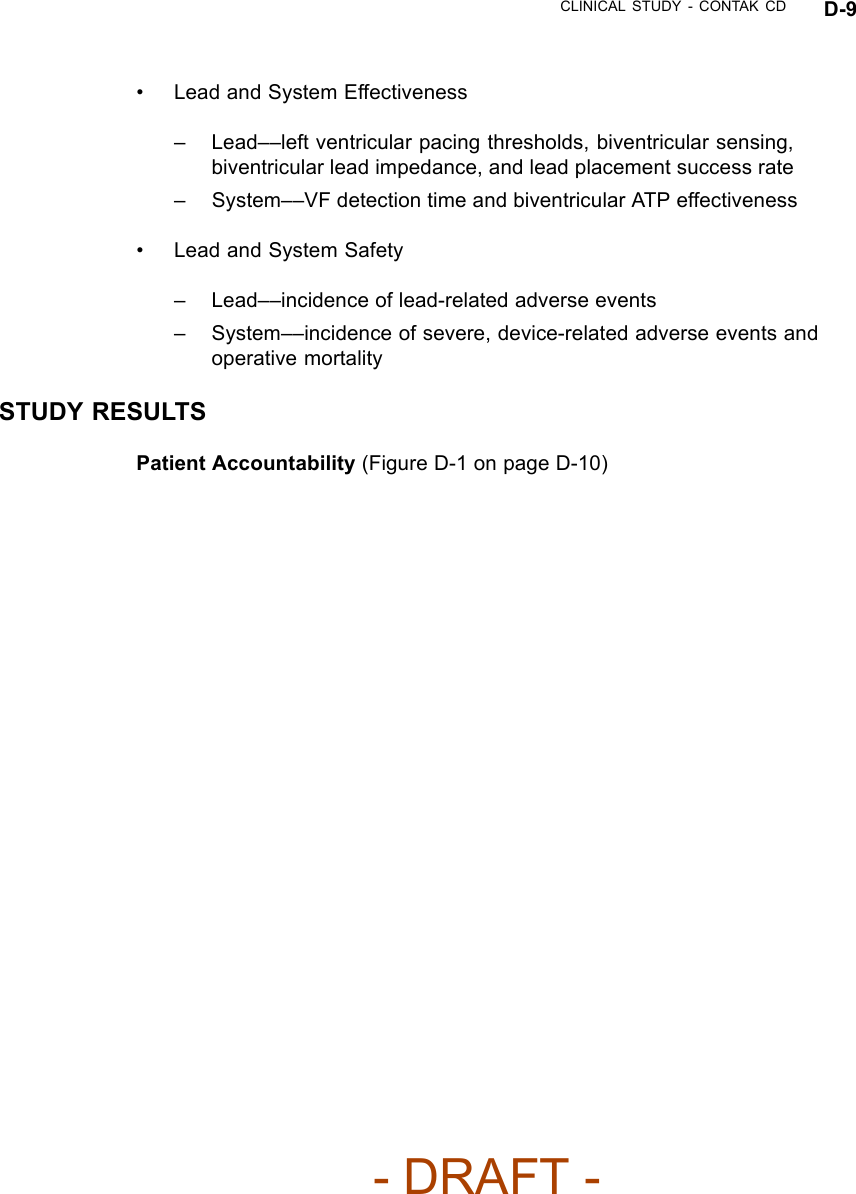
![B-16 CLINICAL STUDY - COMPANIONTable B-5. Patient population characteristics for COMPANION (OPT and CRT-D)Characteristic OPT(N = 308)CRT-D(N = 595)P-valueAge (years) Mean ± SD 66.7 ± 10.7 65.6 ± 11.2 0.14Female 97 (31.4) 194 (32.6) 0.73Gender [N (%)]Male 211 (68.5) 401 (67.3) 0.73Class III 253 (82.1) 512 (86.1) 0.12NYHA Classification [N (%)]Class IV 55 (17.8) 83 (13.9) 0.12Ischemic 58.7 54.6 0.13Ischemic Etiology (%)Non-ischemic 41.3 45.4 0.13LVEF (%) Mean ± SD 22.8 ± 7.2 22.5 ± 6.8 0.47Resting Heart Rate (bpm) Mean ± SD 72 ± 12 73 ± 13 0.37QRS Width (ms) Mean ± SD 156 ± 24 159 ± 24 0.09LBBB 69.8 72.9 0.21Non-specific21.4 16.8 0.21Conduction Abnormality (%)RBBB 8.77 10.2 0.21Duration of Heart Failure (years) Mean ± SD 4.86 ± 4.41 4.44 ± 3.83 0.43Diuretic 94.4 96.6 0.12ACE inhibitor or ARB 88.6 89.6 0.66Beta Blockers 66.2 67.6 0.69Aldosterone Antagonist 54.8 55.1 0.94Heart Failure Medications [(%)]Digoxin 67.2 70.9 0.25PATIENT ACCOUNTABILITY AND FOLLOW-UP DURATIONThe COMPANION study enrolled 1638 patients, with 1520 patients randomizedto a treatment group and one hundred eighteen patients (118) not randomizeddue to changes in patient condition or consent between time of enrollment andtime of randomization, such that the inclusion criteria were no longer satisfied.Of the 1520 patients, 595 were randomized to CRT-D with a mean follow-up of1.3 years and 308 were randomized to OPT with a mean follow-up of 1.1 years.Figure B-1 on page B-18 provides an overview of patient enrollment.Table B-6 on page B-17 gives a summary (by treatment group) of patientdisposition over time through 12 months after randomization. This does not- DRAFT -](https://usermanual.wiki/Boston-Scientific/CRMN11906.Cognis-Part-4-Manual/User-Guide-886099-Page-2.png)
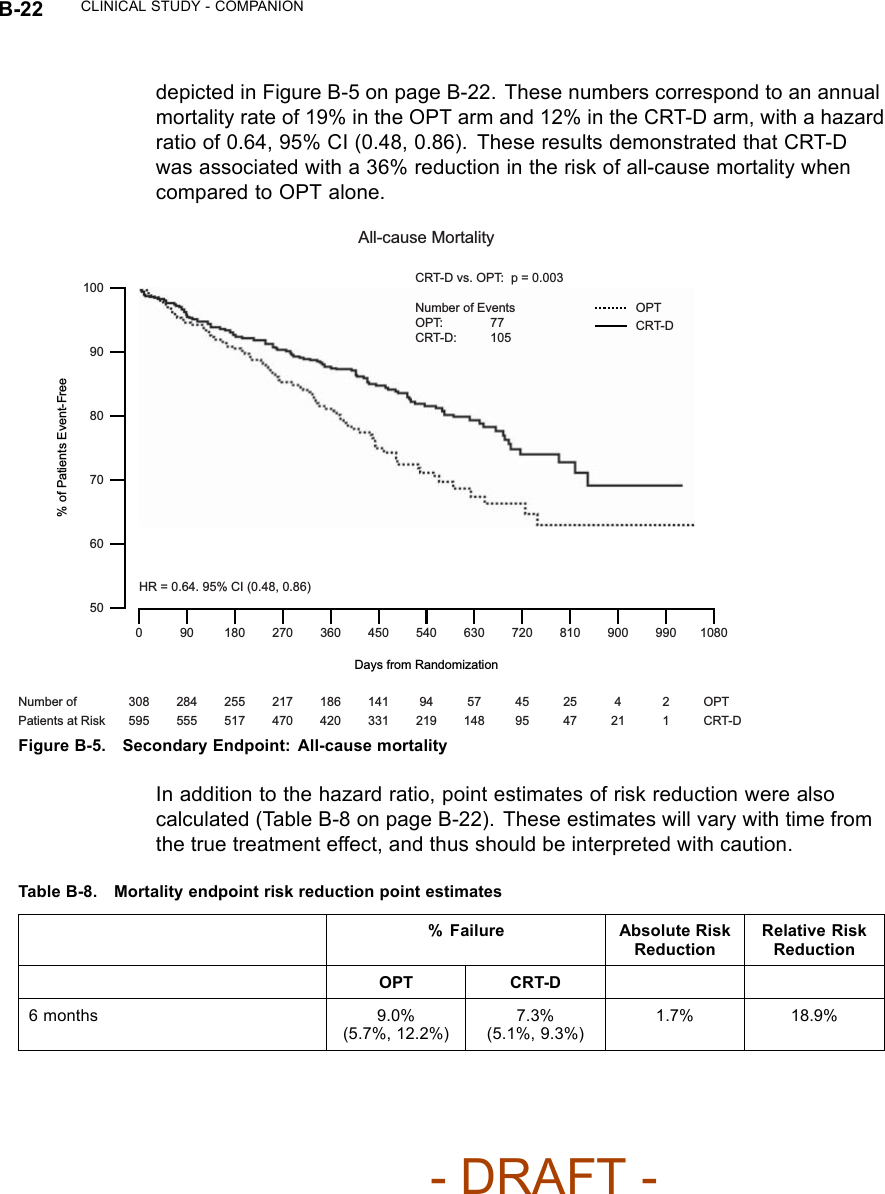
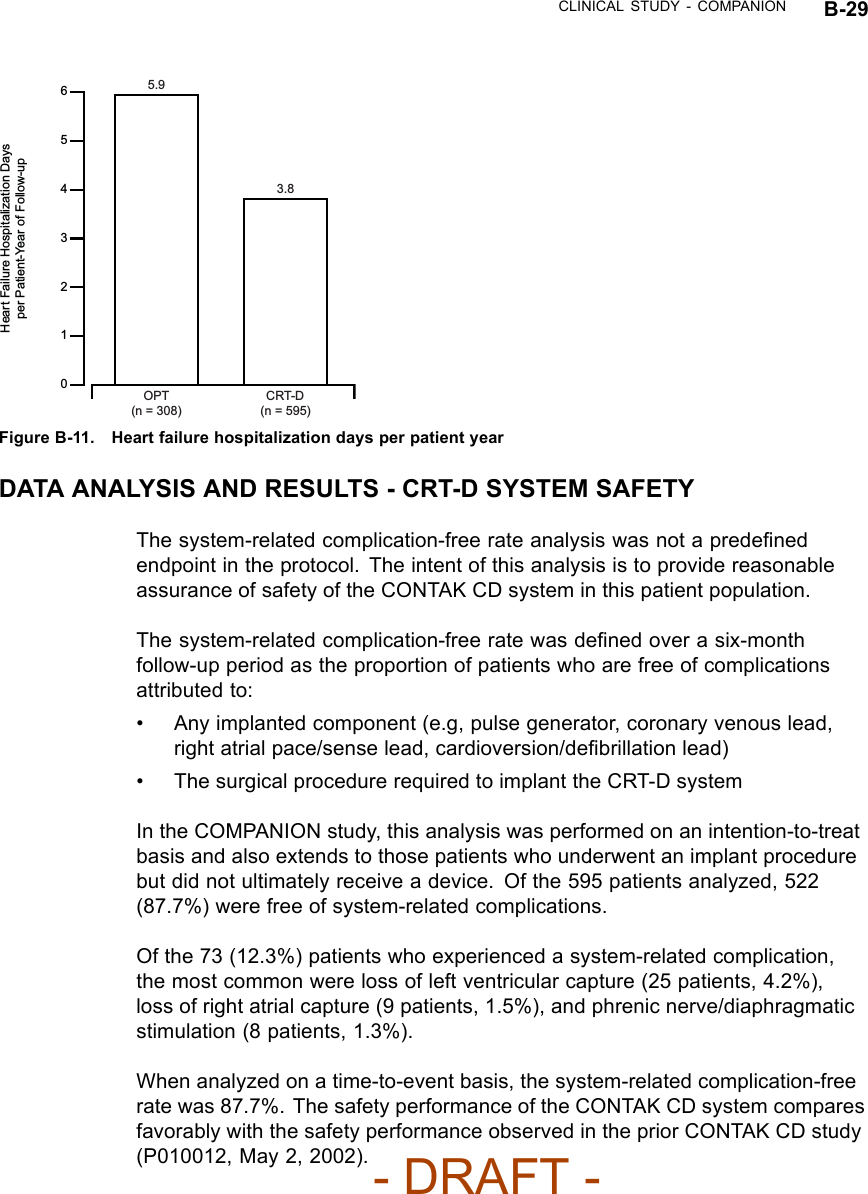
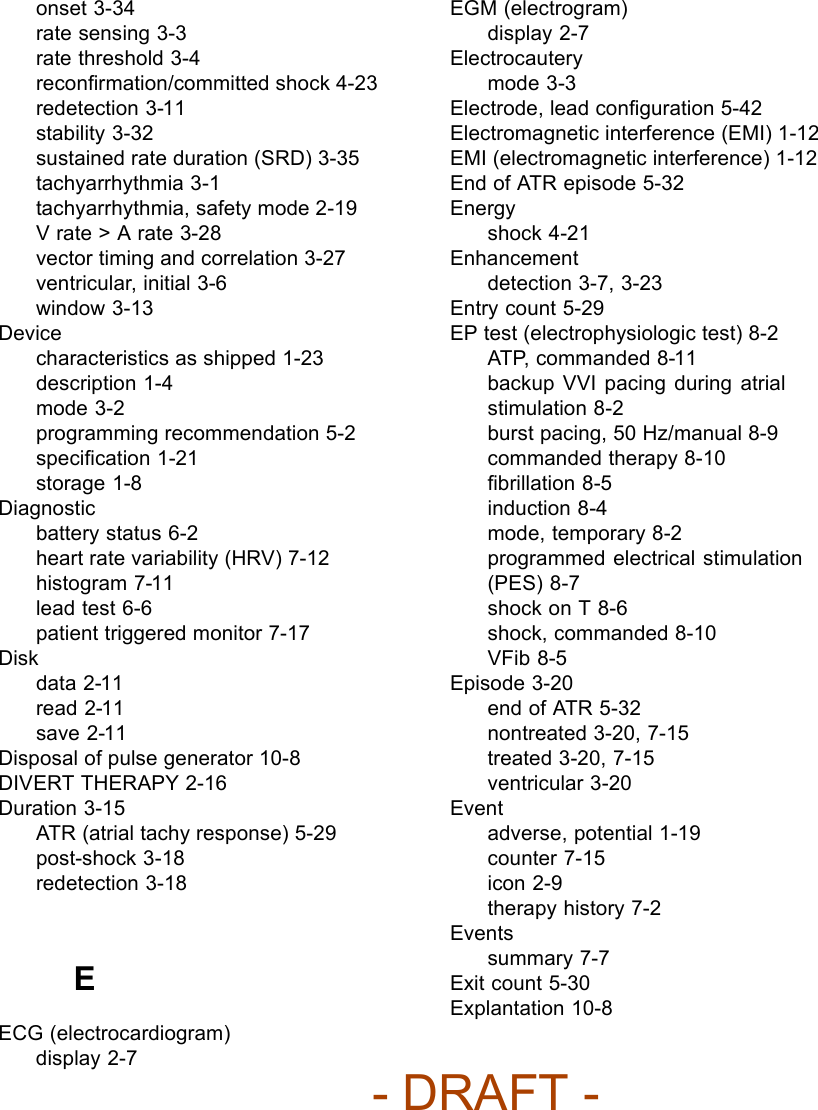
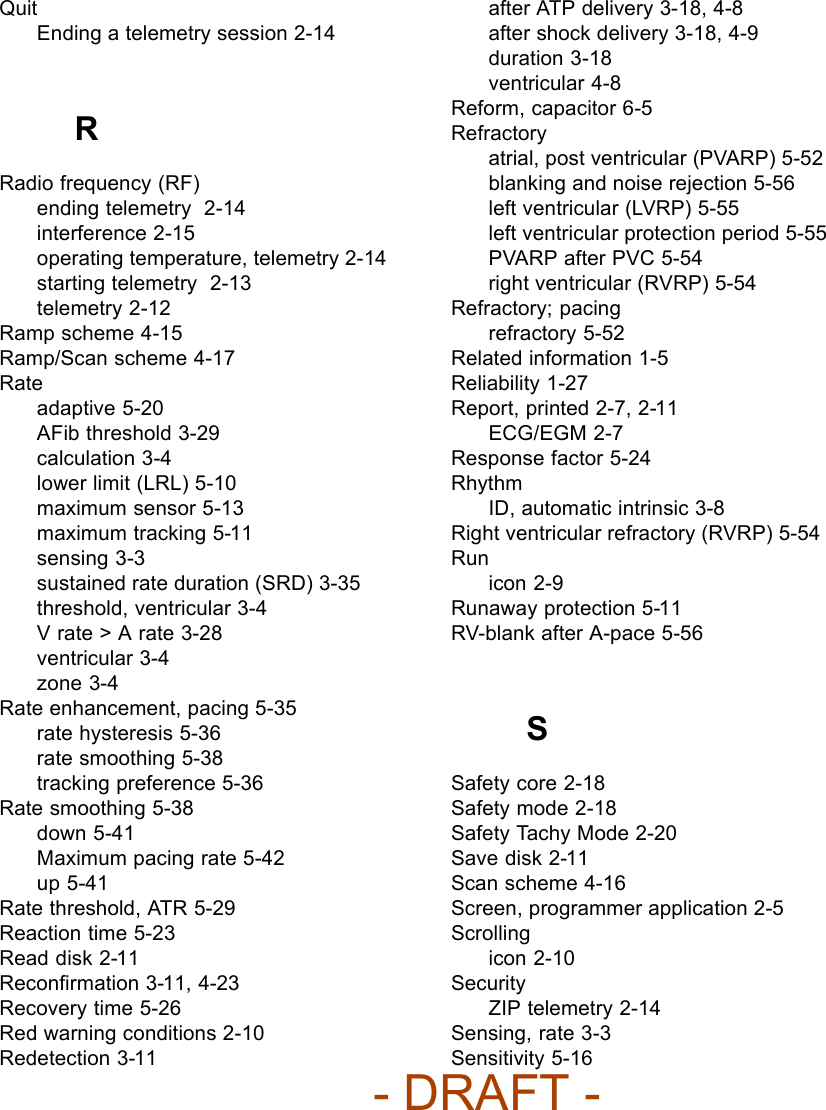
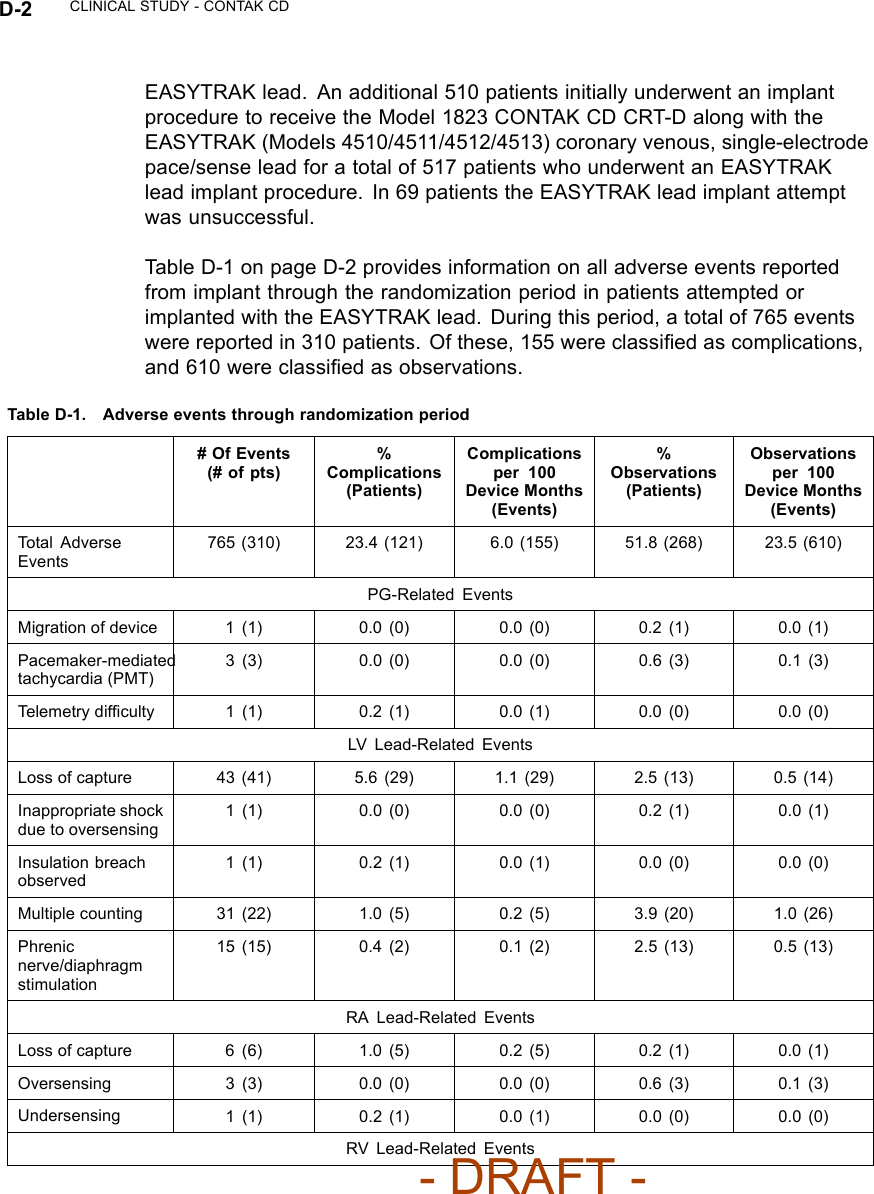
![CLINICAL STUDY - COMPANION B-31Patient Accountability (Figure B-12 on page B-31)OPTBaseline Visit87Peak VO2Assessable for effectiveness466MWAssessable for effectiveness57Patient relatedCrossoverWithdrawnDeathOther11641010654105Peak VO2Assessable for effectiveness2316MWAssessable for effectiveness261Patient relatedMode ChangeWithdrawnDeathOther28201622124121623CRTBaseline Visit318Randomized448Met Exclusion Criteria 6Intent/Attempt 37Figure B-12. Enrollment and follow-up of randomized patientsBaseline Characteristics— (Table B-10 on page B-31)Table B-10. Patient population characteristicsCharacteristic CRT(N = 318)OPT(N = 87)P-valueaAge (years) Mean ± SD 62.1 ± 11.8 63.1 ± 10.6 0.48Range 32.0–86.0 27.0–85.0Gender [N (%)] Female 109 (34.3) 24 (27.6) 0.24Male 209 (65.7) 63 (72.4)NYHA Classification [N (%)] III 294 (92.5) 79 (90.8) 0.61IV 24 (7.5) 8 (9.2)- DRAFT -](https://usermanual.wiki/Boston-Scientific/CRMN11906.Cognis-Part-4-Manual/User-Guide-886099-Page-17.png)
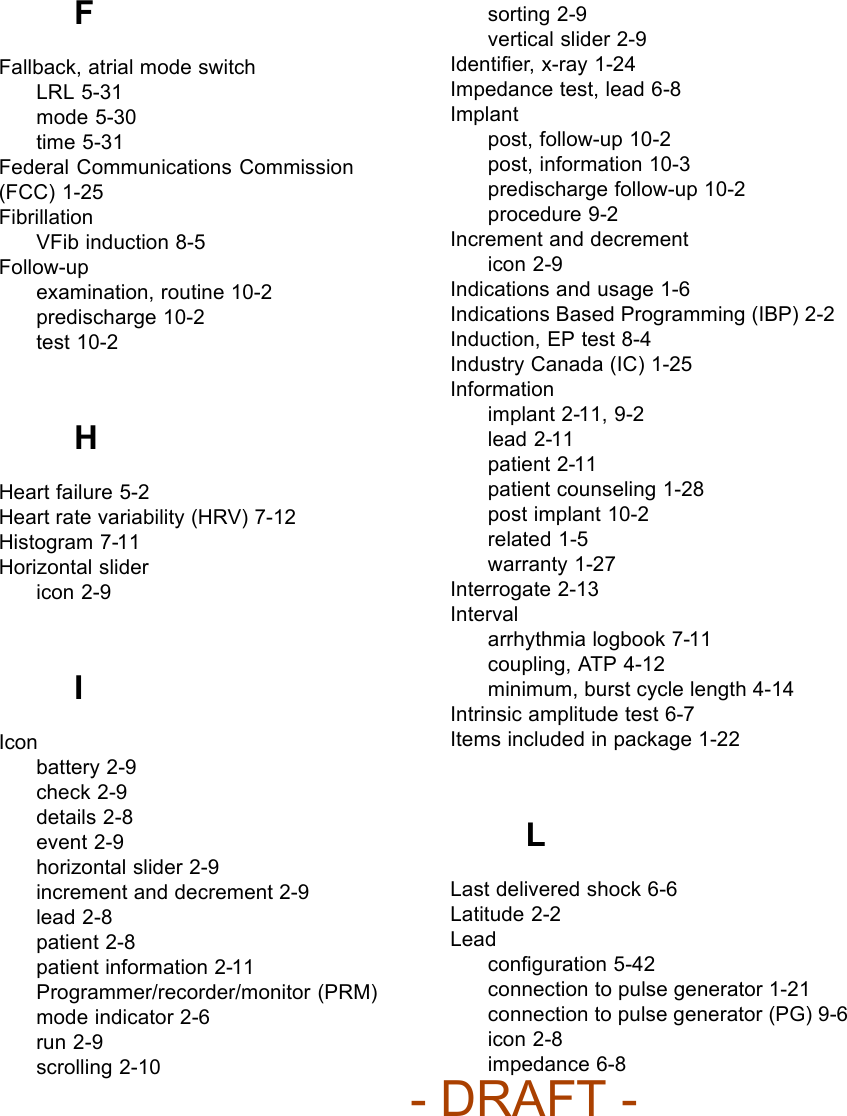
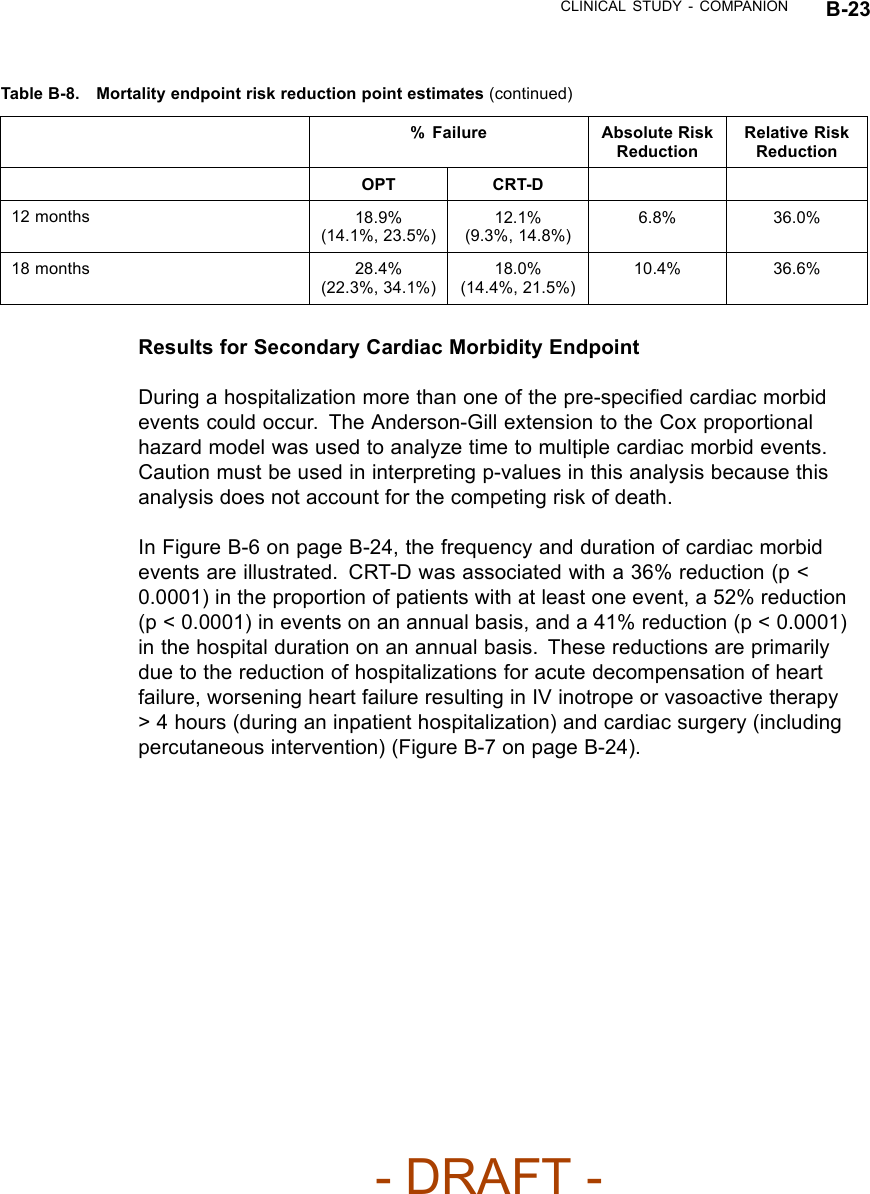
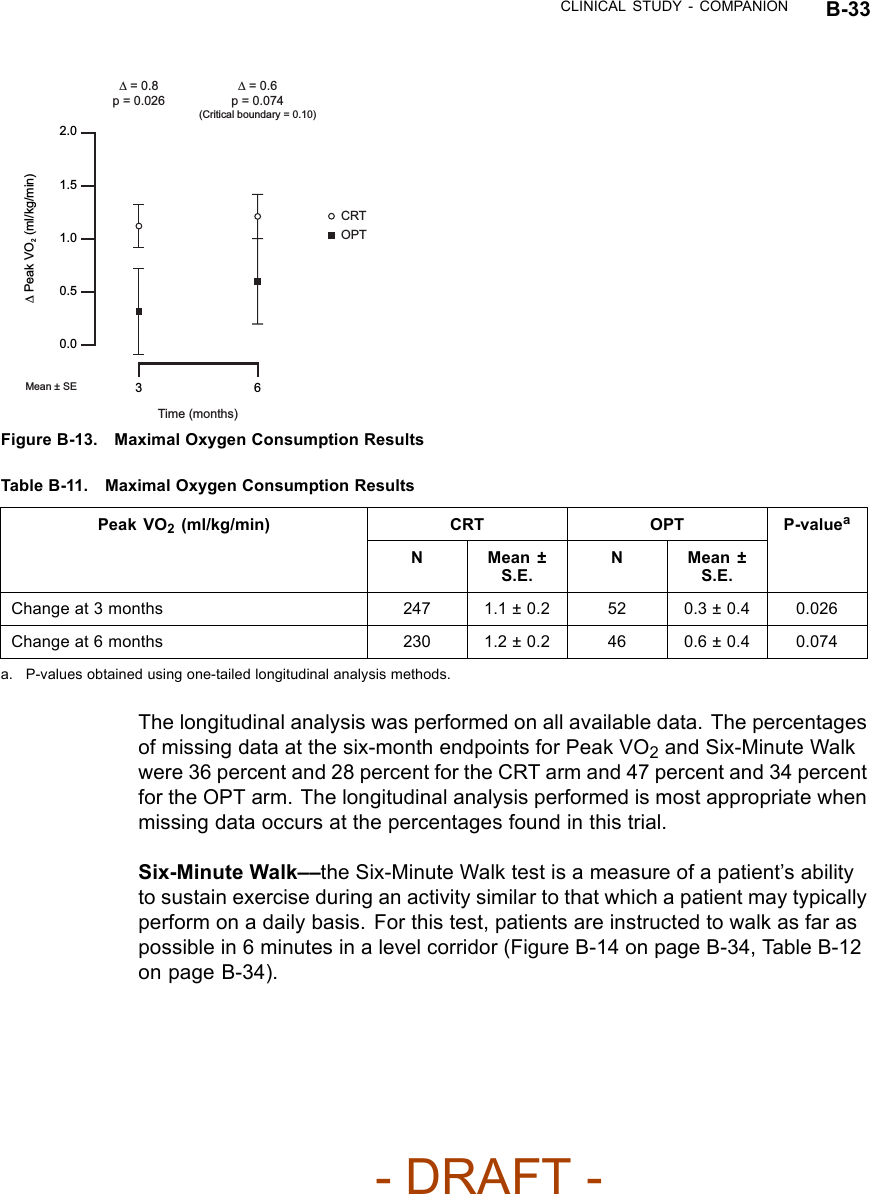
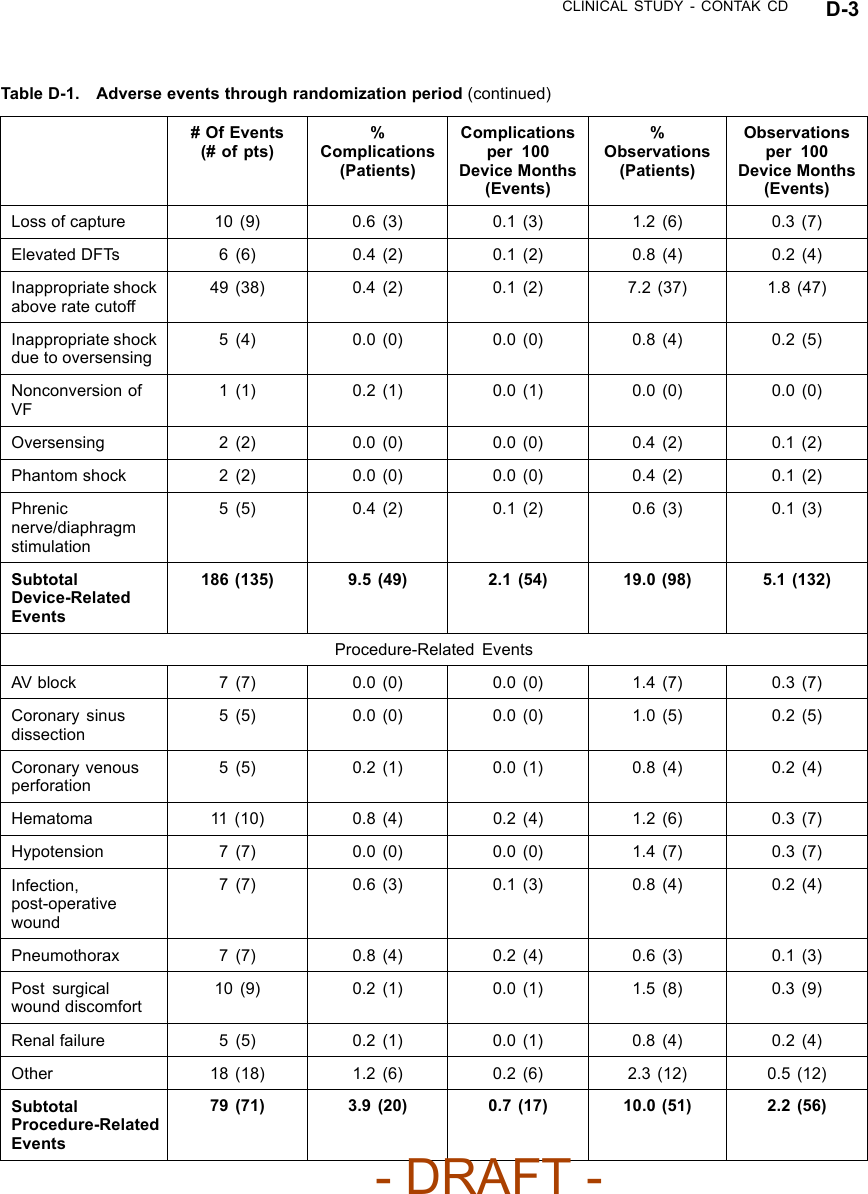
![B-32 CLINICAL STUDY - COMPANIONTable B-10. Patient population characteristics (continued)Characteristic CRT(N = 318)OPT(N = 87)P-valueaIschemic Etiology Ischemic 141 (44.3) 42 (48.3) 0.51Non-ischemic 177 (55.7) 45 (51.7)LVEF (%) Mean ± SD 22.5 ± 6.9 22.2 ± 8.0 0.79Range 5.0–35.0 5.0–35.0Resting Heart Rate (bpm) Mean ± SD 73.1 ± 12.8 73.5 ± 11.5 0.78Range 46.0–122.0 54.0–103.0QRS Width (ms) Mean ± SD 159.2 ± 25.0 155.7 ± 25.8 0.26Range 120.0–276.0 120.0–224.0LBBB/NSIVCD (%) LBBB 230 (72.3) 62 (71.3) 0.60Nonspecific 54 (17.0) 18 (20.7)RBBB 34 (10.7) 7 (8.0)Peak VO2(ml/kg/min) Mean ± SD 12.7 ± 3.3 12.4 ± 3.3 0.42Range 3.0–21.2 4.8–21.5Six-MInute Walk Distance (m) Mean ± SD 292.4 ± 65.5 291.6 ± 70.5 0.92Range 152.0–411.5 162.4–414.0Quality of Life Score (points) Mean ± SD 59.8 ± 23.1 55.4 ± 23.3 0.12Range 0.0–105.0 0.0–97.0Heart Failure Medications [N (%)] Diuretic 300 (94.3) 82 (94.3) 0.98ACE Inhibitor or ARB 286 (89.9) 82 (94.3) 0.22Beta Blockers 240 (75.5) 60 (69.0) 0.22Aldosterone Antagonist 178 (56.0) 51 (58.6) 0.66Digoxin 239 (75.2) 65 (74.7) 0.93a. Continuous data were analyzed using a two-tailed t-test procedure, and categorical data were analyzed using a two-tailedchi-square procedure. A p-value < 0.05 is considered significant.CRT EffectivenessPeak VO2—Peak VO2was determined from a standardized protocol forexercise testing as a means of measuring a patient’s capacity for performingphysical activity (Figure B-13 on page B-33, Table B-11 on page B-33).- DRAFT -](https://usermanual.wiki/Boston-Scientific/CRMN11906.Cognis-Part-4-Manual/User-Guide-886099-Page-18.png)

![C-2 CLINICAL STUDY - DECREASE HFFOLLOW-UP SCHEDULEThe follow-up schedule for the DECREASE HF study is detailed below(Table C-1 on page C-2).Table C-1. DECREASE HF follow-up scheduleFollow-up period Follow-up schedulePre-implant Initial assessment of patient eligibility; taking of patient history.Administration of baseline Quality of Life (QOL) questionnaire.Implant Implant of investigational devices and acute device testing.Two-week visit Physical assessment, including NYHA assessment, and device evaluation.Special Testingato establish the patient’s baseline condition, after which the randomizationassignment was assigned.Three- and six-monthvisitEvaluation of randomized therapy with Special Testing and device functionb.Quarterly visits After the six-month visit, patients were seen for routine evaluation of device functionand patient condition.a. Special Testing included a Symptom-Limited Treadmill Test with measurement of oxygen uptake (Peak VO2), Echocardiography,QOL questionnaire.b. Holter monitor recordings were taken at the three-month visit for patients in the Holter Substudy.INCLUSION/EXCLUSION CRITERIAPatients enrolled in the investigation were required to meet the followinginclusion criteria:• Must meet the general indications for a CRT-D implant• Moderate or severe heart failure, defined as NYHA Class III-IV despiteoptimal pharmacological heart failure therapy• A 12-lead electrocardiogram (ECG) obtained no more than 90 days prior toenrollment documenting a sinus rate > 50 bpm, QRS duration ≥150 ms,PR interval ≤320 ms measured from any two leads and a P-wave duration< 150 ms measured from lead V1• Creatinine ≤2.5 mg/dL obtained no more than 14 days prior to enrollment• Left ventricular ejection fraction ≤35% [measured by echo, multiple gatedacquisition (MUGA) scan, cardiac catheterization, etc.] no more than 14days prior to enrollment- DRAFT -](https://usermanual.wiki/Boston-Scientific/CRMN11906.Cognis-Part-4-Manual/User-Guide-886099-Page-26.png)
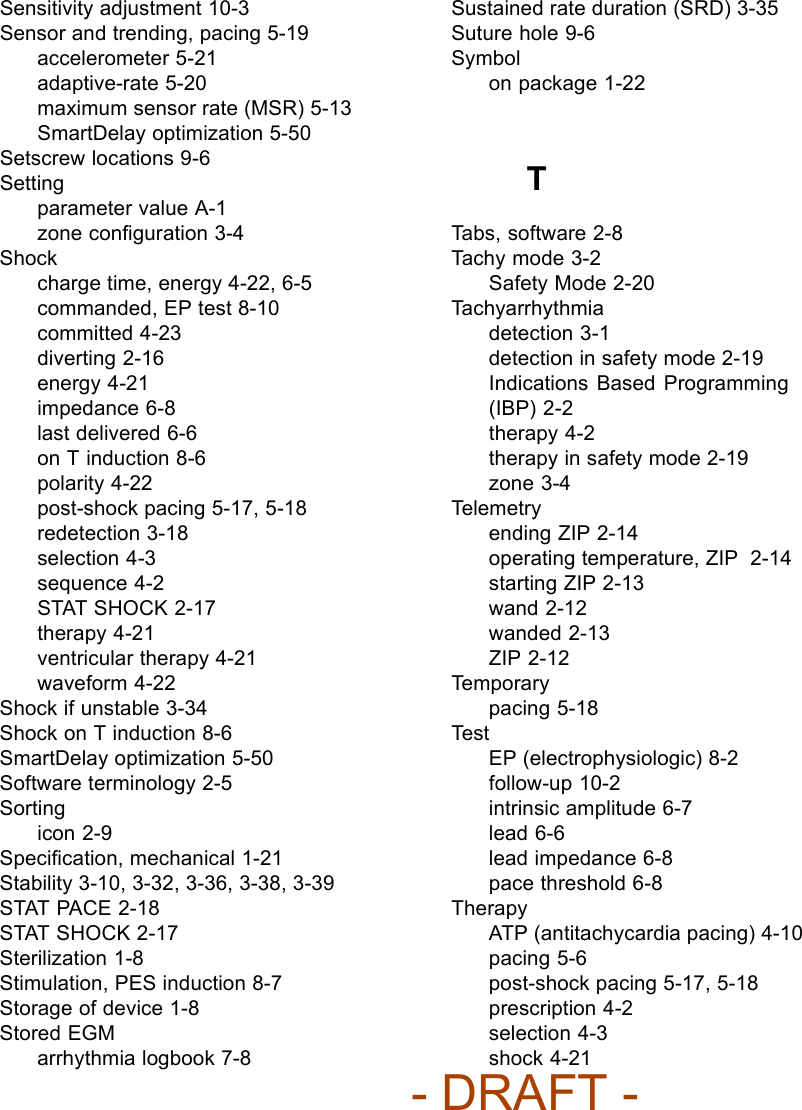
![C-4 CLINICAL STUDY - DECREASE HF• Were enrolled in any concurrent study, without Guidant written approval,that may confound the results of this studyDEMOGRAPHIC DATAPatient enrollment (Figure C-1 on page C-4) and baseline characteristics(Table C-2 on page C-4) are detailed below.Enrolled 360 Implant 342 Attempt 16 Death 1 Intent 2 Death 3 Received Randomization Assignment 325 Withdrawal 1 Incomplete Baseline Testing 13 Expert Ease BiV Suggestion 19 Randomized 306 LV-CRT 101 LV Offset 104 BiV-CRT 101 Safety Arm 32 Figure C-1. DECREASE-HF Study Patient Enrollment and RandomizationTable C-2. DECREASE-HF study patient characteristicsCharacteristic Measurement LV-CRT(N=101)LV Offset(N=104)BiV-CRT(N=101)P-valueaAge at Implant (years) N 101 104 101Mean ± SD 67.4 ± 9.6 66.6 ± 10.5 66.2 ± 10.6 0.69Range 45.4 - 87.3 32.4 - 85.6 40.6 - 86.2Gender [N (%)] Male 66 (65) 70 (67) 69 (68) 0.90Female 35 (35) 34 (33) 32 (32)NYHA Class [N (%)] III 98 (97) 100 (96) 101 (100) 0.16IV 3(3) 4(4) 0(0)- DRAFT -](https://usermanual.wiki/Boston-Scientific/CRMN11906.Cognis-Part-4-Manual/User-Guide-886099-Page-28.png)
![CLINICAL STUDY - DECREASE HF C-5Table C-2. DECREASE-HF study patient characteristics (continued)Characteristic Measurement LV-CRT(N=101)LV Offset(N=104)BiV-CRT(N=101)P-valueaLVEF (%) N 101 104 100Mean ± SD 22.6 ± 6.6 22.4 ± 6.7 23.2 ± 7.1 0.67Range 8.0 - 35.0 9.0 - 35.0 5.0 - 35.0QRS Duration (ms) N 101 104 101Mean ± SD 165 ± 15 167 ± 16 168 ± 15 0.29Range 150 - 220 150 - 220 150 - 218PR Interval (ms) N 101 104 101Mean ± SD 195 ± 42 195 ± 42 194 ± 39 0.98Range 120 - 318 100 - 320 88 - 320P-Wave Duration (ms) N 101 104 101Mean ± SD 91 ± 22 96 ± 22 95 ± 24 0.21Range 39 - 140 40 - 140 40 - 145Concomitant Medicationsb[N(%)]ACE Inhibitor/ARB 88 (87) 88 (85) 91 (90) 0.50Beta Blocker 84 (83) 84 (81) 82 (81) 0.89Digoxin 47 (47) 55 (53) 46 (46) 0.52Diuretic 89 (88) 93 (89) 82 (81) 0.19Loop Diuretic 87 (86) 91 (88) 80 (79) 0.22Nonloop Diuretic 8(8) 8(8) 8(8) 1.00Aldosterone Antagonist 40 (40) 37 (36) 40 (40) 0.79Antiarrhythmic 21 (21) 14 (13) 13 (13) 0.22Etiology [N (%)] Ischemic 67 (66) 70 (67) 58 (57) 0.27Nonischemic 34 (34) 34 (33) 43 (43)Conduction Disorder [N (%)] Left Bundle BranchBlock94 (93) 95 (91) 97 (96) 0.68NonspecificIntraventricularConduction6(6) 8(8) 4(4)Right Bundle BranchBlock1(1) 1(1) 0(0)a. P-values for continuous variables were calculated from a Student’s t-test; p-values for discrete variables were calculated froma Chi-squared test.b. Patients may appear in more than one category.- DRAFT -](https://usermanual.wiki/Boston-Scientific/CRMN11906.Cognis-Part-4-Manual/User-Guide-886099-Page-29.png)


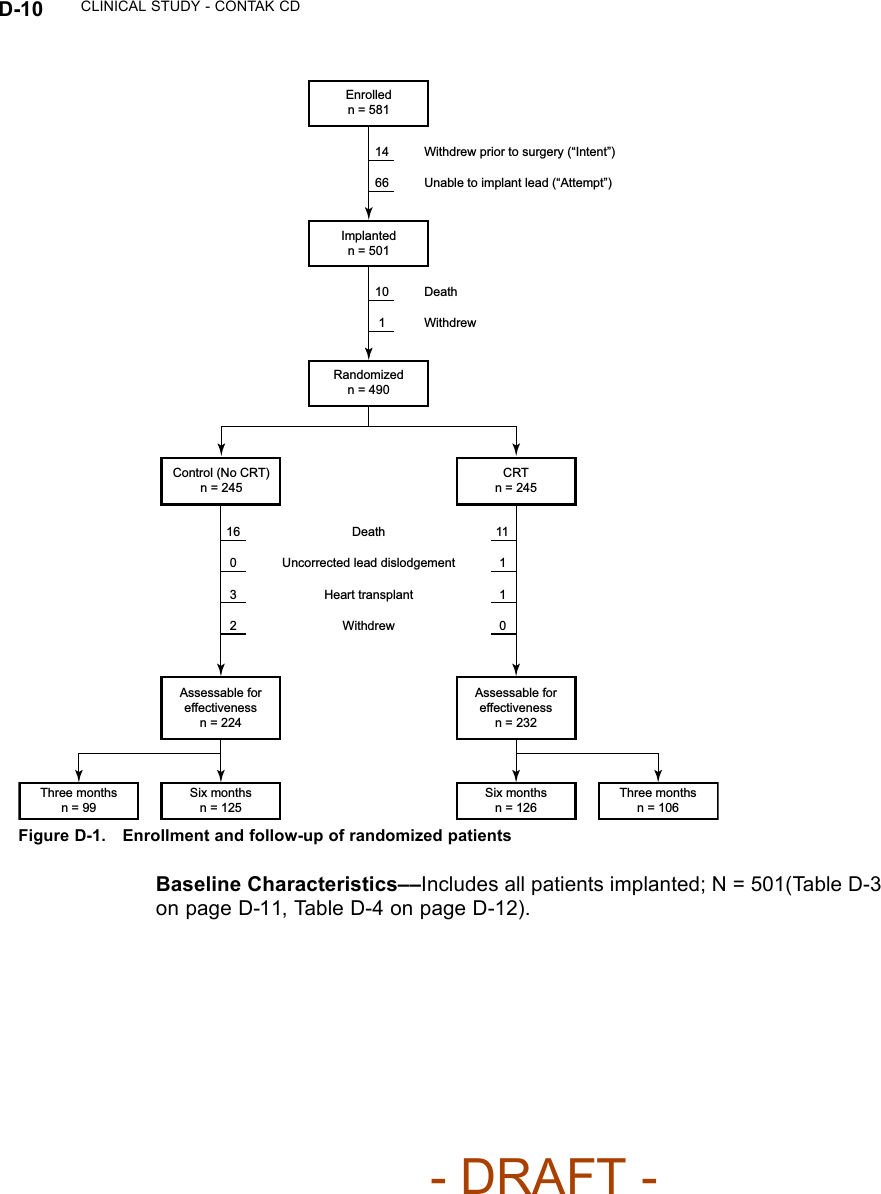
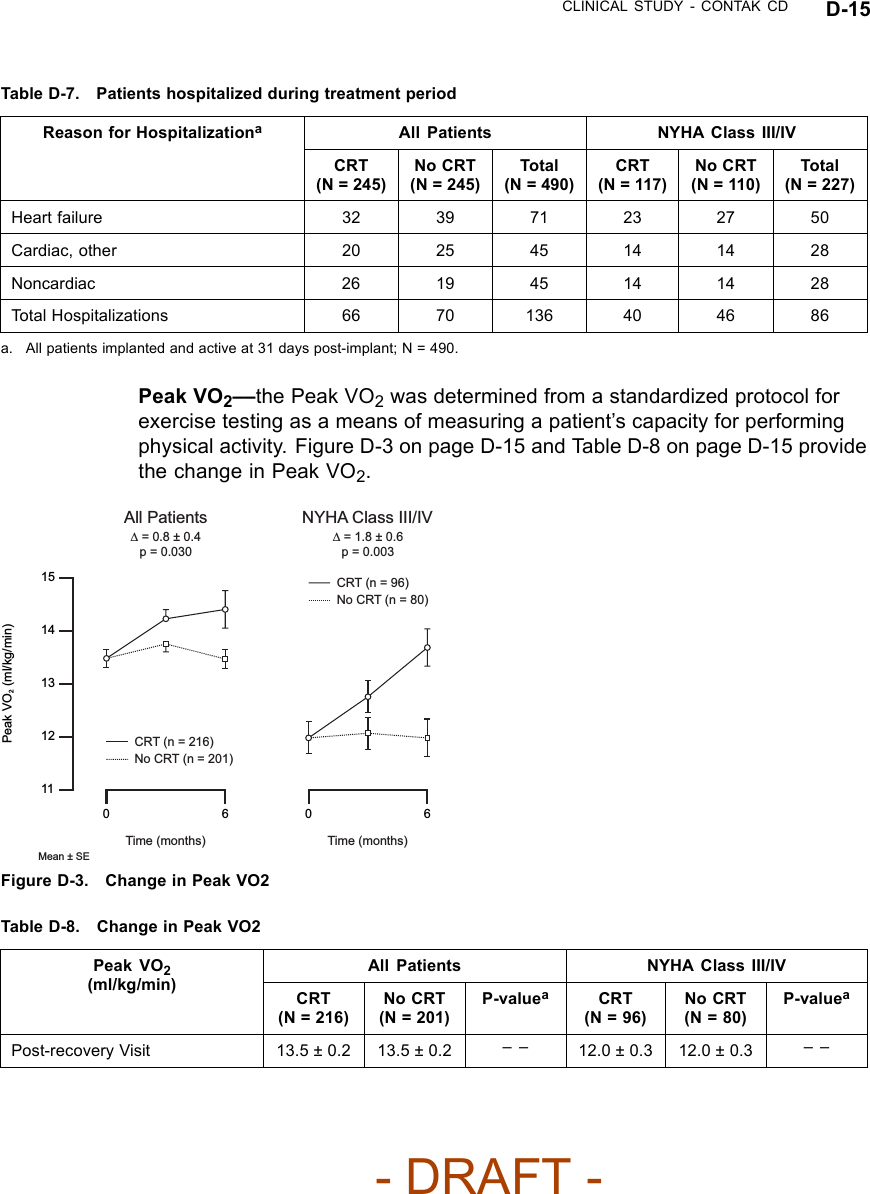
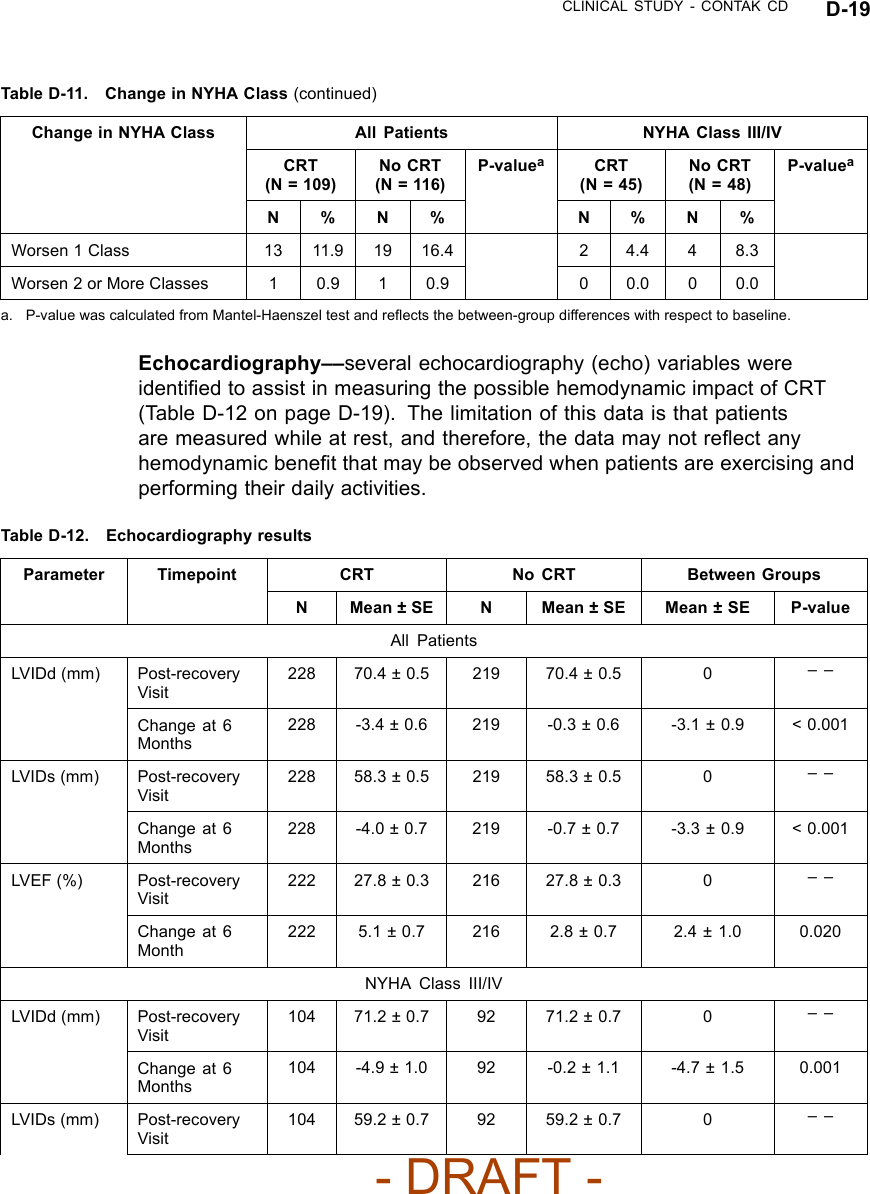
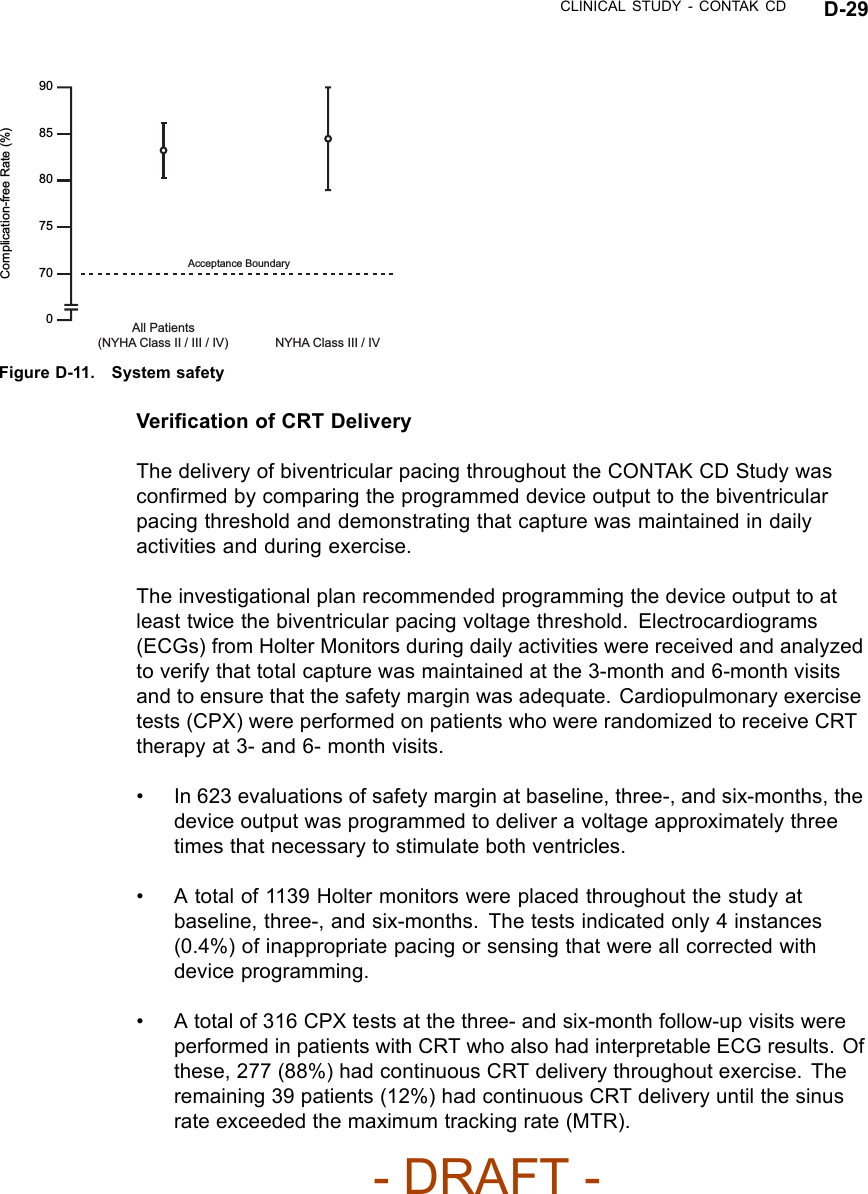
![CLINICAL STUDY - CONTAK CD D-11Table D-3. Pre-implant assessmentAll Patients NYHA Class III/IVCharacteristicCRT(N = 248)No CRT(N = 253)P-valueaCRT(N = 117)No CRT(N = 110)P-valueaAge at Implant(years)N 248 253 117 110Mean ±SD66.0 ± 10.5 66.3 ± 10.5 0.73 66.1 ±10.565.8 ± 10.5 0.80Range 26.1 - 82.6 29.5 - 86.3 26.1 - 82.5 38.3 - 85.3Gender [N (%)] Male 210 (84.7) 211 (83.4) 0.70 90 (76.9) 86 (78.2) 0.82Female 38 (15.3) 42 (16.6) 27 (23.1) 24 (21.8)NYHA Class [N(%)]II 80 (32.3) 83 (32.8) 0.66 20 (17.1) 11 (10.0) 0.08III 148 (59.7) 144 (56.9) 85 (72.6) 78 (70.9)IV 20 (8.1) 26 (10.3) 12 (10.3) 21 (19.1)ConcomitantMedications [N(%)]ACE orARB212 (85.5) 224 (88.5) 0.31 95 (81.2) 98 (89.1) 0.10BetaBlocker119 (48.0) 117 (46.2) 0.70 53 (45.3) 44 (40.0) 0.42Digoxin 172 (69.4) 171 (67.6) 0.67 84 (71.8) 75 (68.2) 0.55Diuretic 217 (87.5) 210 (83.0) 0.16 108 (92.3) 95 (86.4) 0.15Qualifying LVEF(%)N 248 253 117 110Mean ±SD21.4 ± 6.6 21.5 ± 6.7 0.74 20.6 ± 6.4 21.1 ± 6.2 0.61Range 5.0 - 35.0 10.0 - 35.0 8.0 - 35.0 10.0 - 35.0PR Intervalb(ms) N 224 222 107 91Mean ±SD205± 42 202 ± 49 0.44 204 ± 41 200 ± 54 0.60Range 88 - 336 104 - 400 136 - 336 110 - 400Qualifying QRSDurationb(ms)N 226 224 109 93Mean ±SD160 ± 27 156 ± 26 0.06 164 ± 27 152 ± 24 < 0.01Range 120 - 240 120 - 264 120 - 240 120 - 222Resting Heart Rate( bpm)N 248 253 117 110- DRAFT -](https://usermanual.wiki/Boston-Scientific/CRMN11906.Cognis-Part-4-Manual/User-Guide-886099-Page-53.png)
![D-12 CLINICAL STUDY - CONTAK CDTable D-3. Pre-implant assessment (continued)All Patients NYHA Class III/IVCharacteristicCRT(N = 248)No CRT(N = 253)P-valueaCRT(N = 117)No CRT(N = 110)P-valueaMean ±SD73 ± 12 75 ± 14 0.37 75 ± 13 74 ± 15 0.61Range 43 - 108 48 - 120 43 - 108 50 - 120Systolic BloodPressure (mmHg)N 247 253 116 110Mean ±SD118 ± 21 118 ± 21 0.95 116 ± 20 117 ± 23 0.72Range 79 - 197 70 - 190 79 - 191 74 - 190Diastolic BloodPressure (mmHg)N 247 253 116 110Mean ±SD67 ± 12 69 ± 12 0.27 68 ± 12 67 ± 14 0.85Range 31 - 100 40 - 109 31 - 100 40 - 109a. P-values for comparing means were calculated with Student’s t-test; p-values for comparing proportions were calculated withPearson’s chi-squared test.b. PR interval and QRS duration were not obtained for thoracotomy patients.Table D-4. Pre-implant historyAll Patients NYHA Class III/IVCharacteristicCRT(N = 248)No CRT(N = 253)P-valueaCRT(N = 117)No CRT(N = 110)P-valueaPrimaryTachyarrhythmia [N(%)]MonomorphicVT (MVT)148(59.7)136(53.8)0.44 72 (61.5) 48 (43.6) 0.03PolymorphicVT (PVT)16 (6.5) 20 (7.9) 7 (6.0) 7 (6.4)NonsustainedVT58 (23.4) 63 (24.9) 30 (25.6) 35 (31.8)VentricularFibrillation(VF)26 (10.5) 32 (12.6) 8 (6.8) 18 (16.4)Other 0 (0.0) 2 (0.8) 0 (0.0) 2 (1.8)Other Arrhythmias [N(%)]ParoxysmalAtrialFibrillation43 (17.3) 62 (24.5) 0.05 21 (17.9) 29 (26.4) 0.13Atrial Flutter 10 (4.0) 13 (5.1) 0.55 3 (2.6) 7 (6.4) 0.16- DRAFT -](https://usermanual.wiki/Boston-Scientific/CRMN11906.Cognis-Part-4-Manual/User-Guide-886099-Page-54.png)
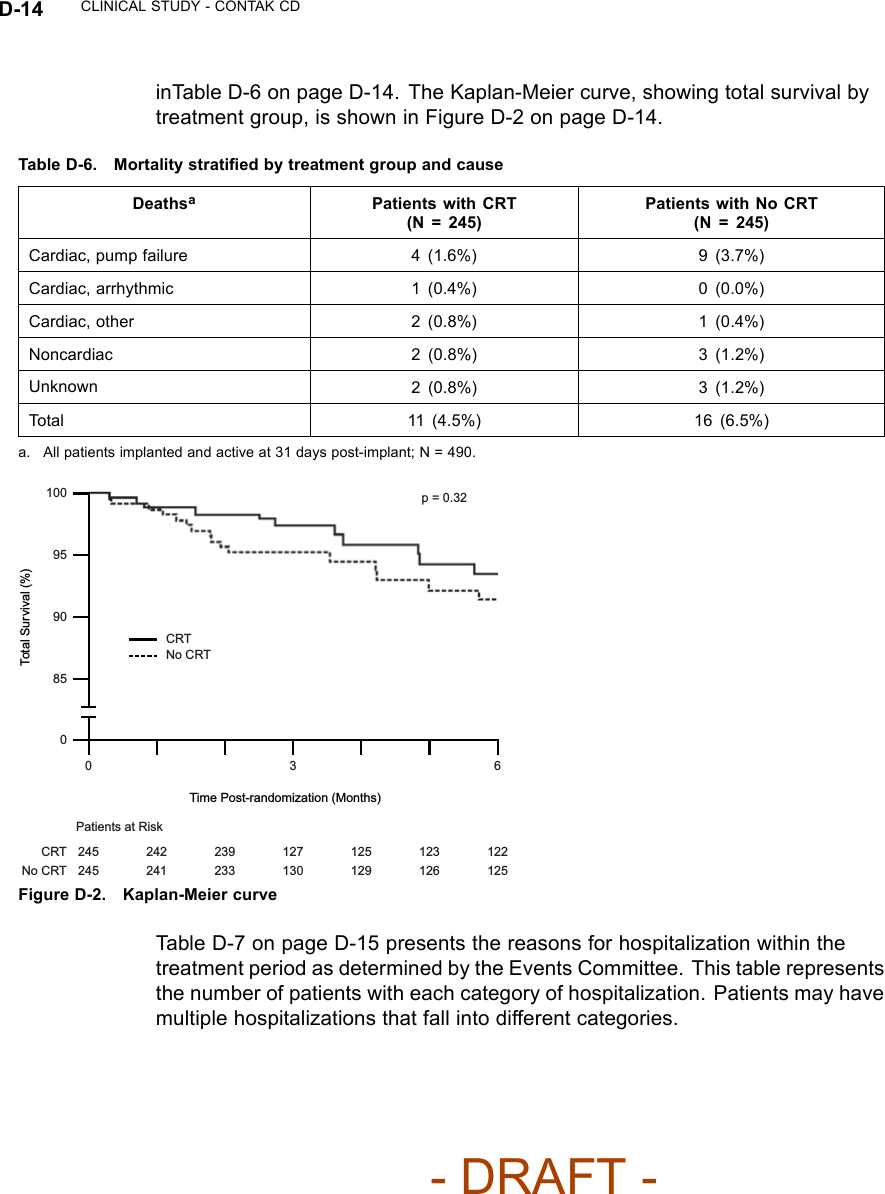
![CLINICAL STUDY - CONTAK CD D-13Table D-4. Pre-implant history (continued)All Patients NYHA Class III/IVCharacteristicCRT(N = 248)No CRT(N = 253)P-valueaCRT(N = 117)No CRT(N = 110)P-valueaArrhythmia/ConductionDisorder [N (%)]LBBB 133(53.6)138(54.5)0.83 59 (50.4) 59 (53.6) 0.55RBBB 35 (14.1) 31 (12.3) 21 (17.9) 14 (12.7)Non-Specific 80 (32.3) 84 (33.2) 37 (31.6) 37 (33.6)Etiology [N (%)] Ischemic 167(67.3)178(70.4)0.47 76 (65.0) 78 (70.9) 0.34Non-Ischemic 81 (32.7) 75 (29.6) 41 (35.0) 32 (29.1)a. P-values were calculated with Pearson’s chi-squared test.CRT EffectivenessHeart Failure Progression (Composite Index)––the Composite Index(primary endpoint) was a combination of three events: all-cause mortality,hospitalization for heart failure, and VT/VF event requiring therapy (Table D-5on page D-13). A committee consisting of three heart failure specialists andan electrophysiologist reviewed and adjudicated all patient deaths and allhospitalizations, defined as an admission greater than 23 hours. Outpatientcare, emergency room care, and clinic visits less than 23 hours were collectedbut not considered to be hospitalizations for the purposes of analysis.Table D-5. Heart Failure Progression (Composite Index)CRT No CRTGroupaHeart Failure Mortalityor Morbidity Event N%N%Relative Reductionwith CRTAll Patients(N = 490)Death from any cause 114.5166.5 15% p = 0.35HF hospitalization 32 13.1 39 15.9VT/VF 36 14.7 39 15.9NYHA Class III/IV(N = 227)Death from any cause 11 9.4 11 10.0 22% p = 0.23HF hospitalization 23 19.7 27 24.5VT/VF 21 17.9 22 20.0a. All patients implanted and active 31 days post-implant.Twenty-seven patients died during the therapy phase. Mortality stratified bytreatment group and cause, as adjudicated by the Events Committee, is shown- DRAFT -](https://usermanual.wiki/Boston-Scientific/CRMN11906.Cognis-Part-4-Manual/User-Guide-886099-Page-55.png)
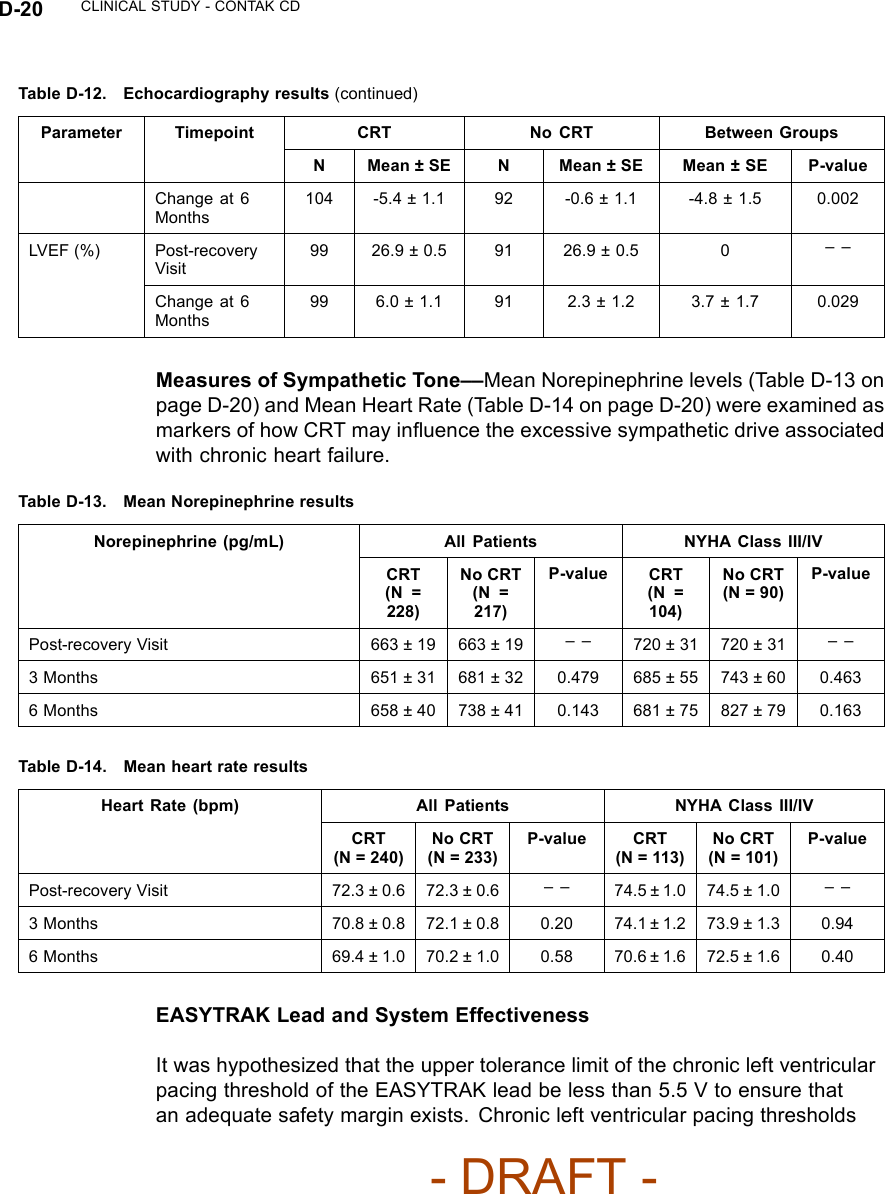
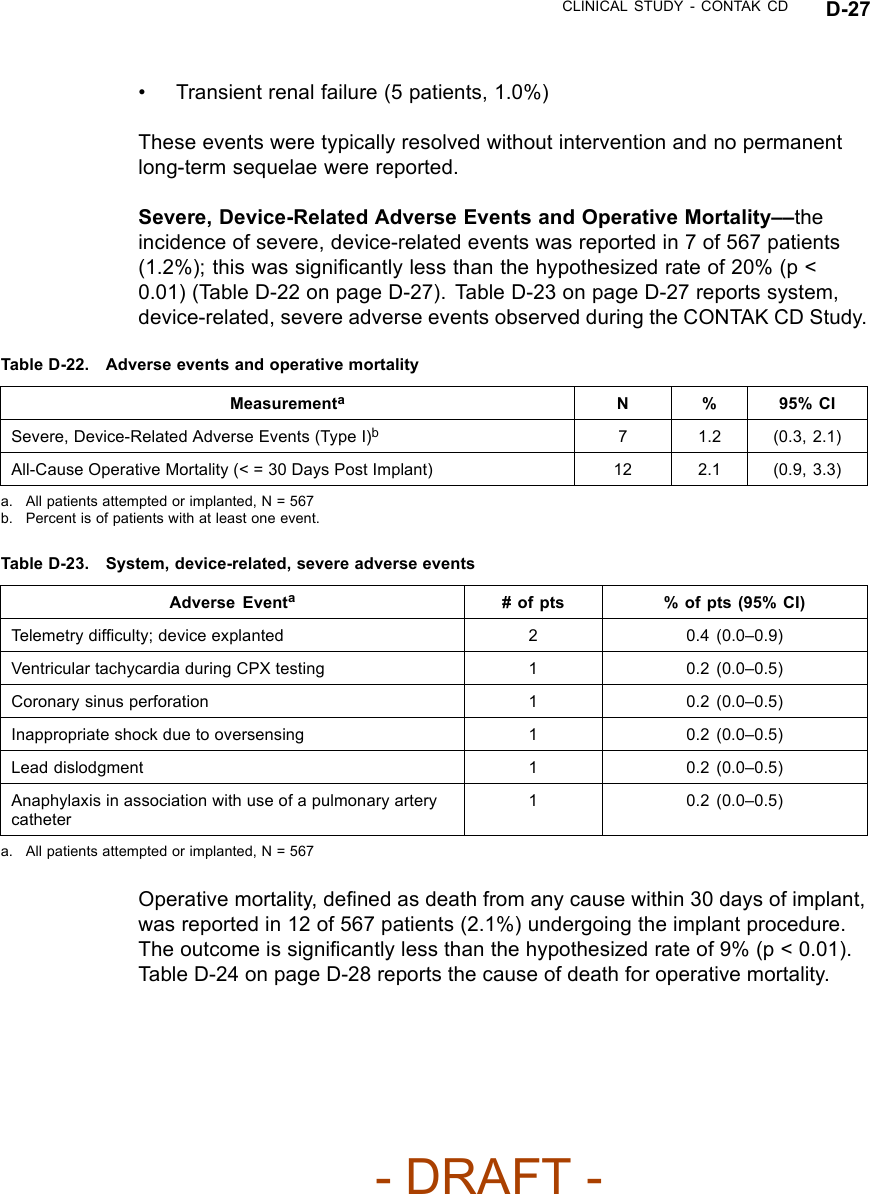
![CLINICAL STUDY - CONTAK CD D-25Biventricular ATP Conversion Effectiveness Performance––the conversionrate of induced monomorphic ventricular tachycardia (MVT) was 64% andthat of spontaneous MVT was 88%.Ventricular Tachyarrhythmia Detection Time––the VENTAK CHF andCONTAK CD devices sense events from both ventricles simultaneously.Ventricular tachyarrhythmia detection time was analyzed to determine if theadditional lead had an adverse effect on sensing VT/VF. Guidant’s ICDstypically have a detection time of two seconds. The VF detection time of 2.1± 0.6 seconds was statistically significantly lower than 6 seconds (p < 0.01),demonstrating that there was no statistically significant prolongation of inducedVF detection times with the additional left ventricular lead1.Therewerealsono adverse events reported in which a VENTAK CHF or CONTAK CD failed todetect a spontaneous ventricular tachyarrhythmia.EASYTRAK Lead and System SafetyEASYTRAK Lead Safety––safety was established using the rate of adverseevents that are either related to the EASYTRAK lead or to the implantprocedure necessary to place the EASYTRAK lead.An EASYTRAK lead implant procedure was performed in 517 patients with 448patients (86.7%) being successfully implanted with the EASYTRAK lead. Theupper boundary of the 95% confidence interval was hypothesized to be lessthan 23% at six months (Table D-20 on page D-25).Table D-20. Lead-related adverse events at six monthsPatient Population N Event Rate (%) 95% CIAll Patients 517 12.2 (9.4, 15.0)NYHA Class III/IV 201 17.4 (12.7, 22.7)Fifty-three lead-related adverse events were reported during the clinicalinvestigation of the EASYTRAK lead among the 448 patients who wereimplanted with an EASYTRAK lead. Twenty-seven procedure-related adverseevents were reported among the 517 patients who underwent the implantprocedure for an EASYTRAK lead.2The overall lead-related adverse event1. Detection time at implant with legally marketed Guidant ICD devices is typically two seconds,and investigators have stated that an additional delay of 3 to 5 seconds would be a clinicallysignificant event. The expected detection time is 2 seconds (95% CI: [0, 6 sec]).2. For purposes of defining event rates, a denominator of 448 will be used for those adverseevents that pertain to chronically implanted EASYTRAK leads, and a denominator of 517 willbe used for those adverse events that pertain to the implant procedure of the EASYTRAK lead.- DRAFT -](https://usermanual.wiki/Boston-Scientific/CRMN11906.Cognis-Part-4-Manual/User-Guide-886099-Page-67.png)
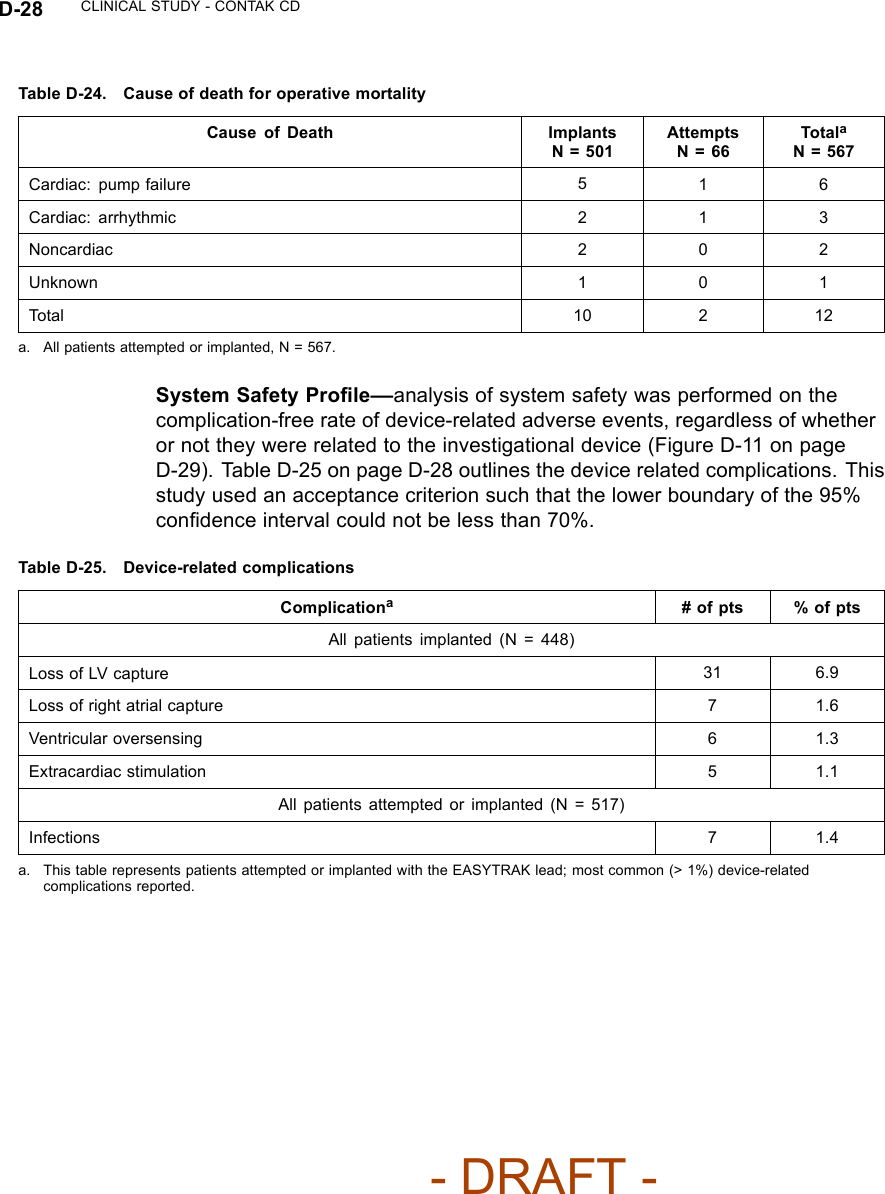
![D-26 CLINICAL STUDY - CONTAK CDratewas14.5%(95%CI[11.5–17.5%]). TableD-21onpageD-26reportslead-related adverse events observed during the CONTAK CD Study.Table D-21. EASYTRAK lead-related adverse eventsAdverse EventsaTotal % of pts (95% Cl)Lead-Related, N = 448Loss of capture/lead dislodgment 31b6.9 (4.6–9.3)Ventricular oversensing 11 2.5 (1.0–3.9)Extracardiac stimulation 9 2.0 (0.7–3.3)Insulation breach 2 0.4 (0.0–1.1)Procedure-Related, N = 517Transient AV block 6 1.2 (0.2–2.1)Coronary venous dissection 51.0 (0.1–1.8)Coronary venous perforation 51.0 (0.1–1.8)Transient renal failure 51.0 (0.1–1.8)Pericardial effusion 20.4 (0.0–0.9)Finishing wire left in lead 10.2 (0.0–0.6)Right ventricular lead dislodgment 1 0.2 (0.0–0.6)Guide wire fracture 10.2 (0.0–0.6)Hypotension due to blood loss 1 0.2 (0.0–0.6)Total (unique patients) 75 14.5 (11.5–17.5)a. All patients implanted, N = 448; All patients attempted, N = 517.b. Twenty-six events were successfully corrected in a repeat procedure.The most common of the 53 lead-related adverse events (>1% incidence)included the following:• Loss of left ventricular capture (31 patients, 6.9%)• Ventricular oversensing (11 patients, 2.5%)• Extracardiac stimulation (9 patients, 2.0%)These events were typically resolved with surgical intervention.The most common of the 27 procedure-related adverse events (> 1%incidence) included the following:• Coronary venous trauma (10 patients, 2.0%)• Transient atrioventricular block (6 patients, 1.2%)- DRAFT -](https://usermanual.wiki/Boston-Scientific/CRMN11906.Cognis-Part-4-Manual/User-Guide-886099-Page-68.png)

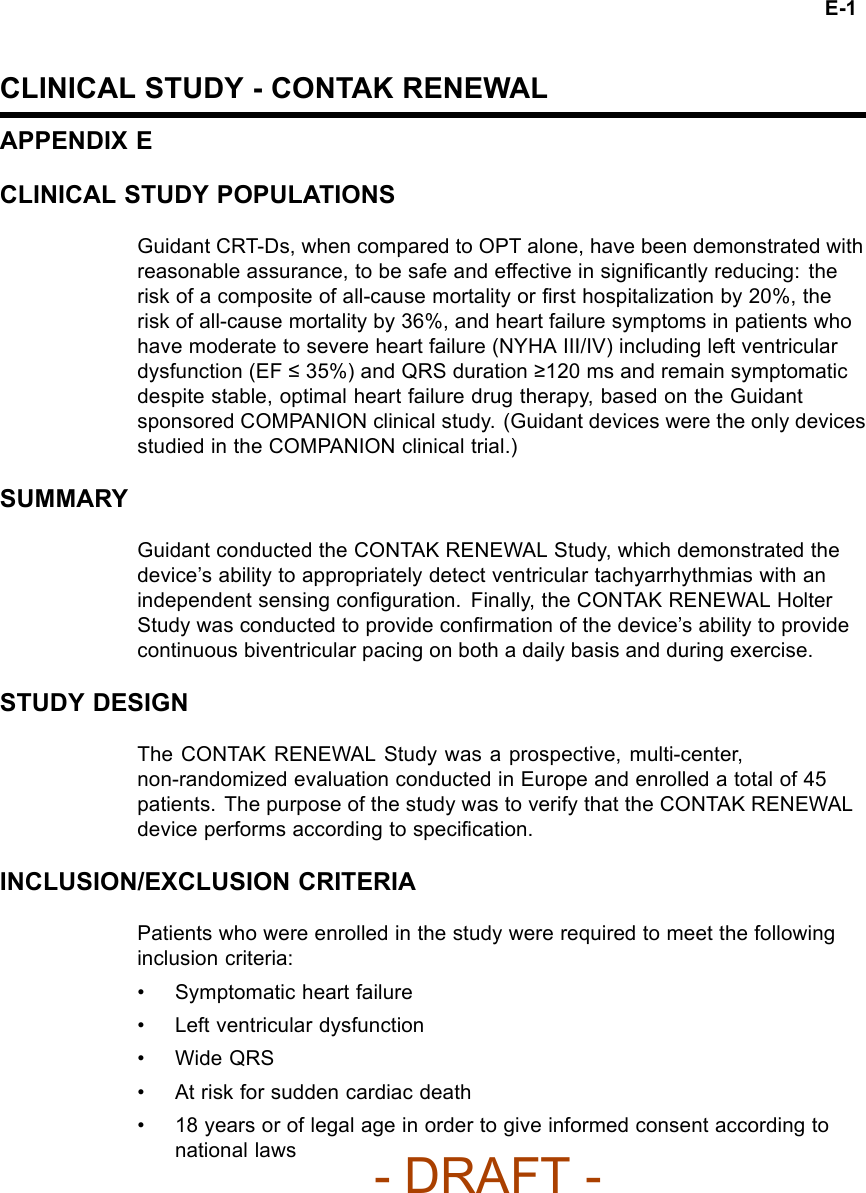
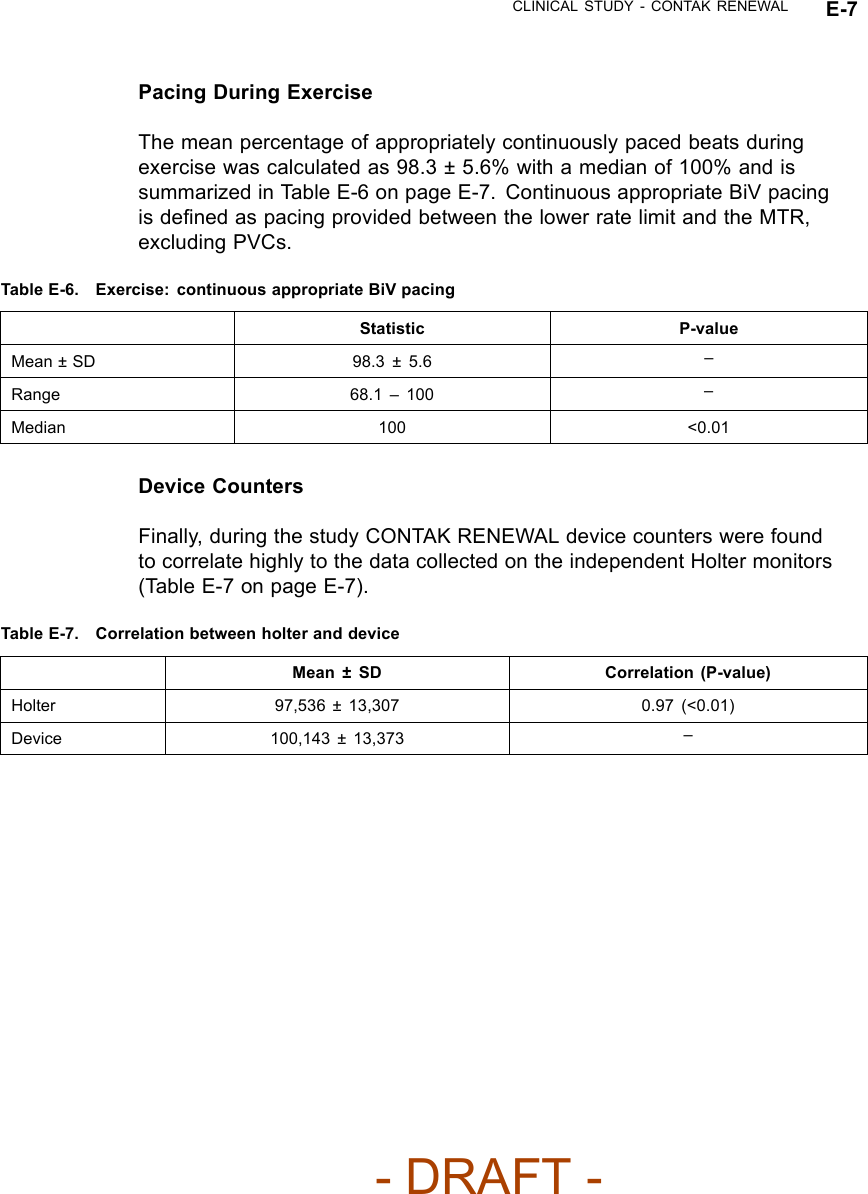
![CLINICAL STUDY - CONTAK RENEWAL E-3Table E-1. Pre-implant characteristics of study patient (continued)CharacteristicsaPatient DataPR Interval 211 ± 49 msResting HR 70 ± 12 bpma. Continuous measures are reported as means ± standard deviations.VENTRICULAR TACHYARRHYTHMIA DETECTION TIMEThe CONTAK RENEWAL device has independent Left Ventricular and RightVentricular Sensing. Ventricular tachyarrhythmia detection time was analyzedto determine if the sensing configuration had any effect on sensing VT/VF.Based on previous clinical studies of the VENTAK AV family, upon which theICD function of CONTAK CD and CONTAK RENEWAL are built, Guidant’sICDs typically have a VF detection time of approximately two seconds. The VFdetection time of 2.4 ± 0.5 seconds in the RENEWAL study was statisticallylower than 6 seconds (p < 0.01), demonstrating that there was no statisticallysignificant prolongation of induced VF detection times with the independentsensing configuration.1There were no adverse events reported in whicha CONTAK RENEWAL device failed to detect a spontaneous ventriculartachyarrhythmia.HOLTER STUDY - CONTAK RENEWALStudy DesignThe CONTAK RENEWAL Holter Study was a prospective, multi-center,non-randomized evaluation conducted in Europe, in which 46 patientscompleted testing. The purpose of the study was to demonstrate continuousappropriate biventricular (BiV) pacing over a 24 hour period and duringexercise using Holter monitor recordings. All patients had been implanted witha CONTAK RENEWAL for a minimum of one month at the time of the studyinitiation.1. Detection time at implant with legally marketed Guidant ICD devices is typically two seconds,and investigators have stated than an additional delay of 3 to 5 seconds would be a clinicallysignificant event. The expected detection time is 2 seconds (95% CI: [0, 6 sec]).- DRAFT -](https://usermanual.wiki/Boston-Scientific/CRMN11906.Cognis-Part-4-Manual/User-Guide-886099-Page-79.png)
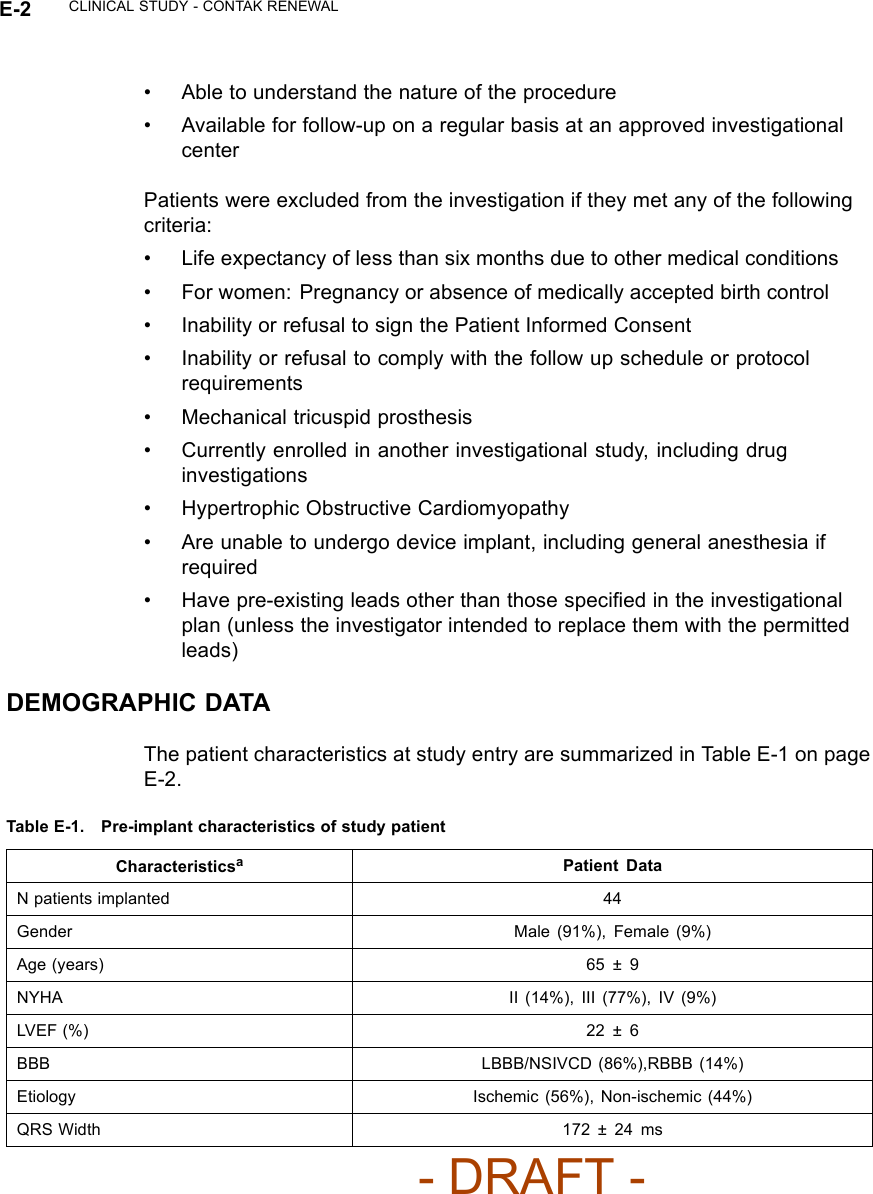
![E-4 CLINICAL STUDY - CONTAK RENEWALInclusion/Exclusion CriteriaPatients who were enrolled in the study were required to meet the followinginclusion criteria:• Availability for 24 hours follow-up at an approved study center• Willingness and ability to participate in all testing associated with this study• Age 18 or above, or of legal age to give informed consent as specifiedby national law• Implanted with the CONTAK RENEWAL system for at least 1 month• Stable when programmed according to labeled recommendations forcontinuous BV pacing• Sinus rhythm at follow-up• Active atrial lead implantedPatients were excluded from the investigation if they met any of the followingcriteria:• Life expectancy of less than six months due to other medical conditions• Concurrent participation in any other clinical study, including drug study•Inatrialfibrillation at follow-up• Inability or refusal to sign the Patient Informed Consent• Inability or refusal to comply with the follow-up schedule• Known pregnancyDemographic DataThe patient characteristics at study entry are summarized in Table E-2 on pageE-4.Table E-2. Pre-implant characteristics of study patientsCharacteristics Patient DataN patients 46Gender Male: 40 (87%), Female: 6 (13%)Age (years) 60.9 ± 9.0NYHA at implant [N (%)] I0(0%)II 5(10.9%)III 34 (73.9%)- DRAFT -](https://usermanual.wiki/Boston-Scientific/CRMN11906.Cognis-Part-4-Manual/User-Guide-886099-Page-80.png)
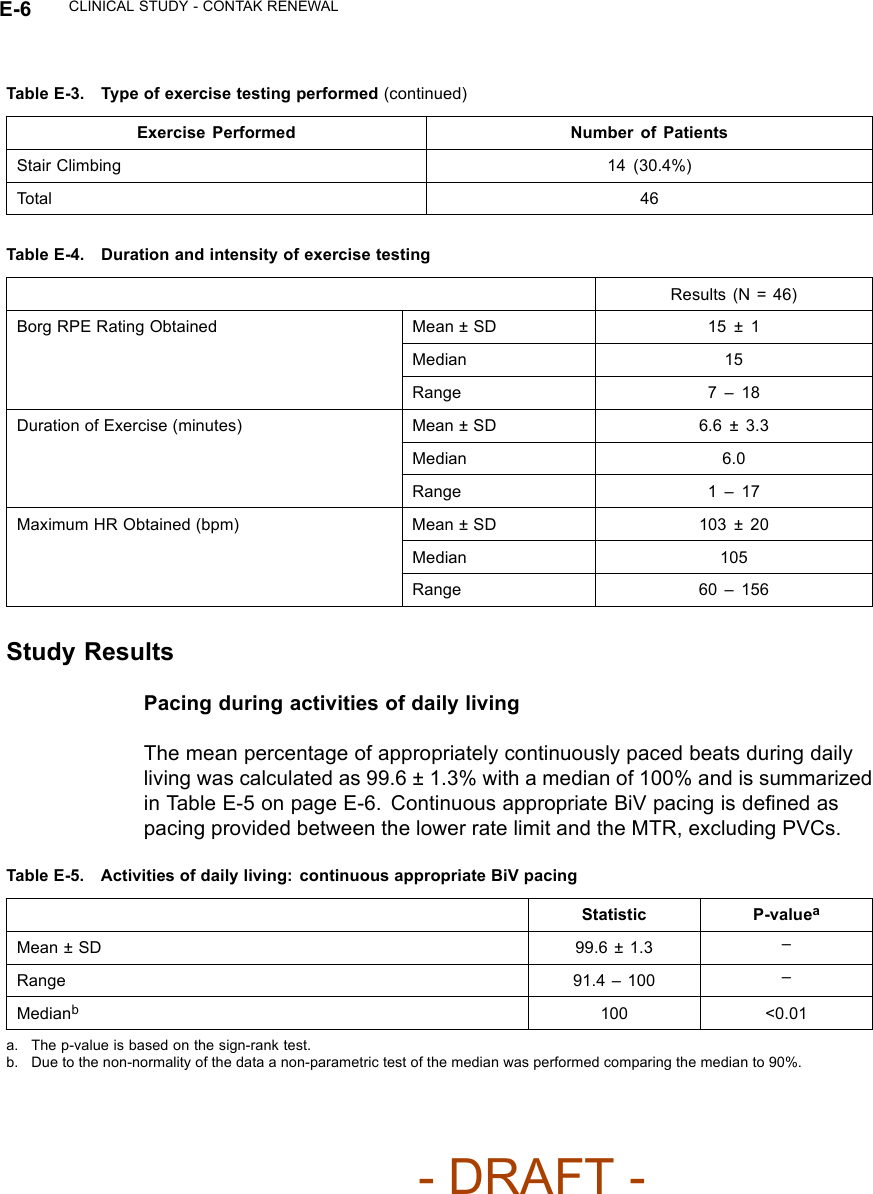
![CLINICAL STUDY - CONTAK RENEWAL E-5Table E-2. Pre-implant characteristics of study patients (continued)Characteristics Patient DataIV 7(15.2)%NYHA current [N (%)] I9(19.6%)II 25 (54.3%)III 11 (23.9%)IV 1 (2.2%)Duration implanted (months) Mean ± SD 8.3 ± 4.1Range 1.5 – 15.0Median 9.0Programming ParametersRefer to the Pacing Therapies chapter for information about programming tomaintain CRT. Programming recommendations in this study were consistentwith the recommendations in that chapter.EndpointsThe study had the following primary endpoints:• Continuous appropriate BiV pacing during activities of daily living• Continuous appropriate BiV pacing during exerciseThe mean percentage of sinus beats appropriately BiV paced was measured bya Holter monitor over a 24 hour period and during exercise. Exercise intensitywas measured using the Borg rating of perceived exertion (RPE) 6-20 scale.PatientswereaskedtoexercisetoaBorglevelof15(difficult). The exerciseprotocol used was left to the discretion of the physician based on the patients’functional status. The type of exercise performed, duration and intensity ofexercise testing is listed in Table E-3 on page E-5 and Table E-4 on page E-6.Table E-3. Type of exercise testing performedExercise Performed Number of PatientsBicycle Ergometry 24 (52.2%)Hall Walk 8(17.4%)- DRAFT -](https://usermanual.wiki/Boston-Scientific/CRMN11906.Cognis-Part-4-Manual/User-Guide-886099-Page-81.png)

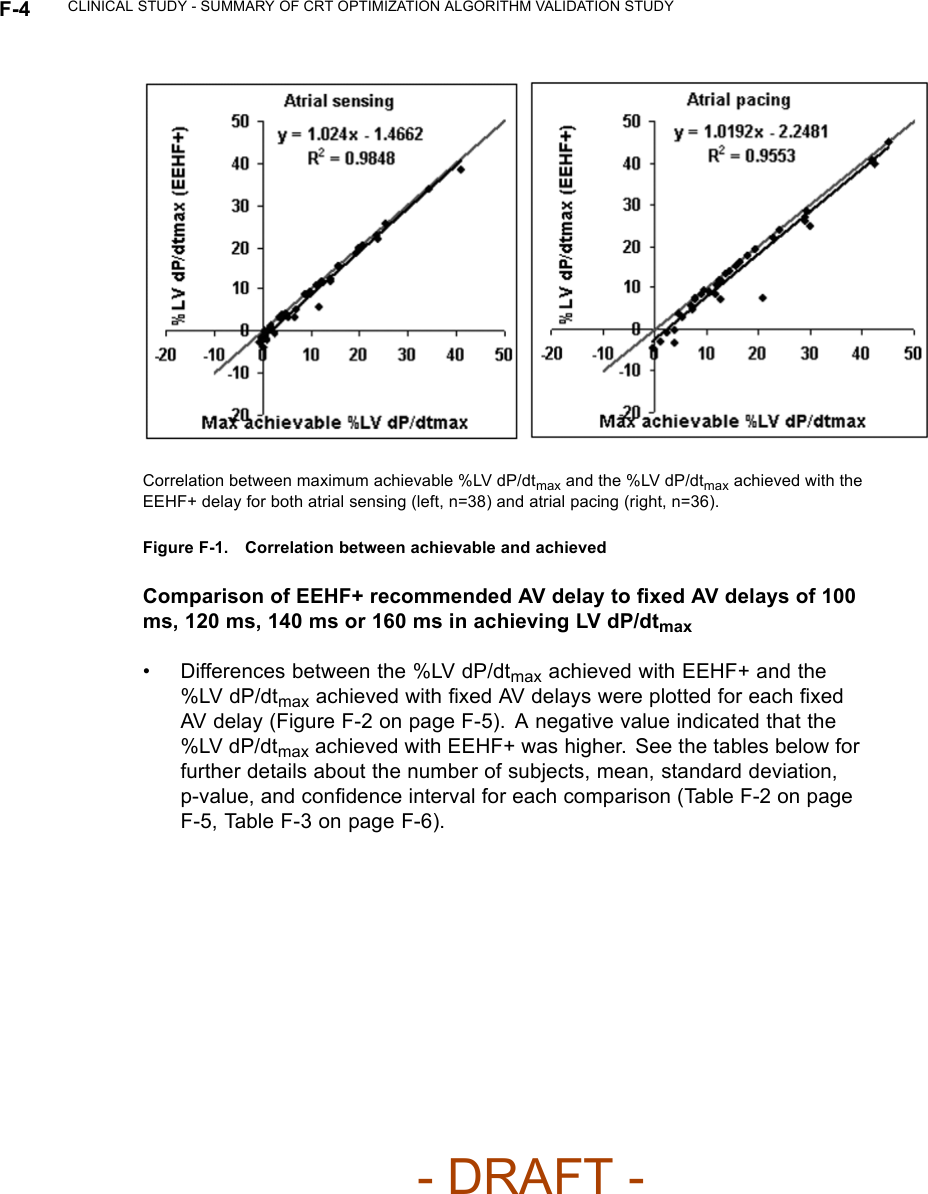
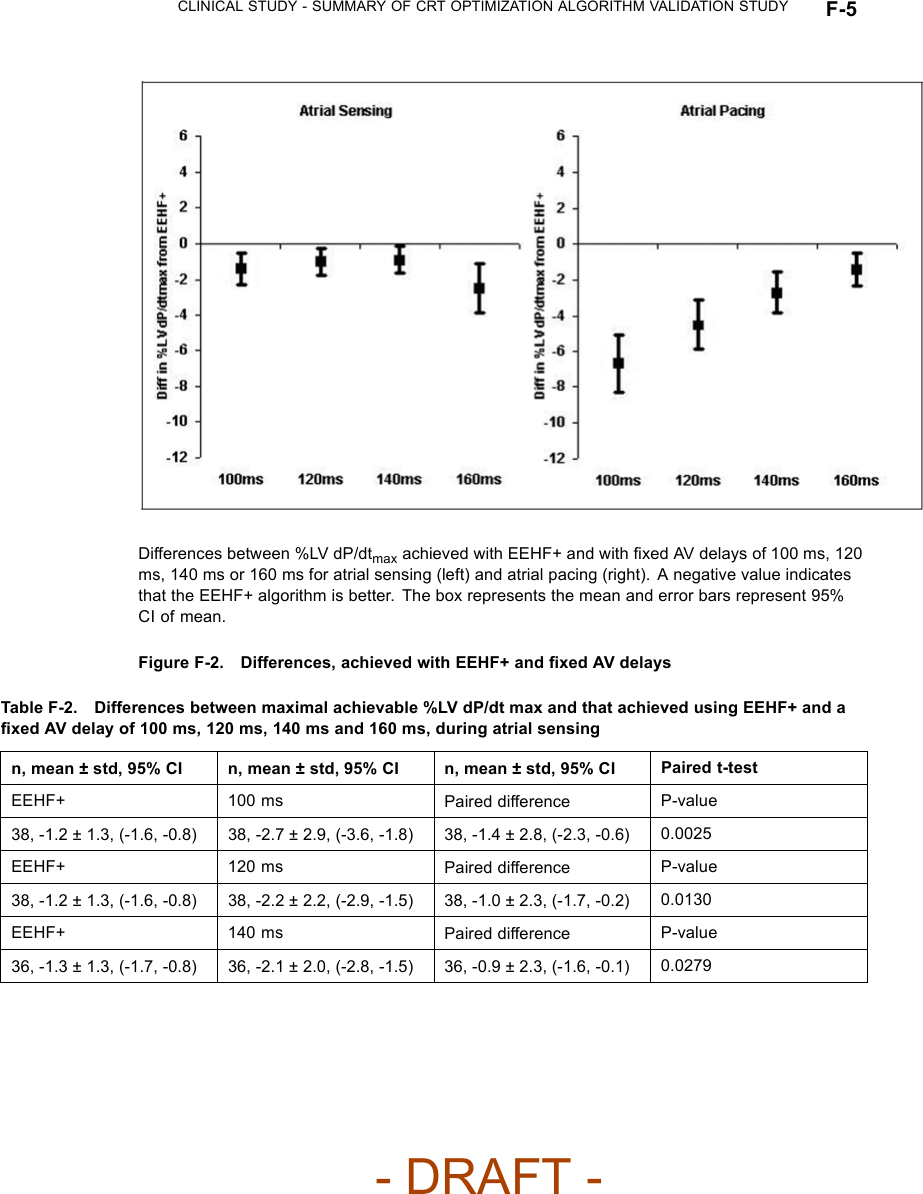
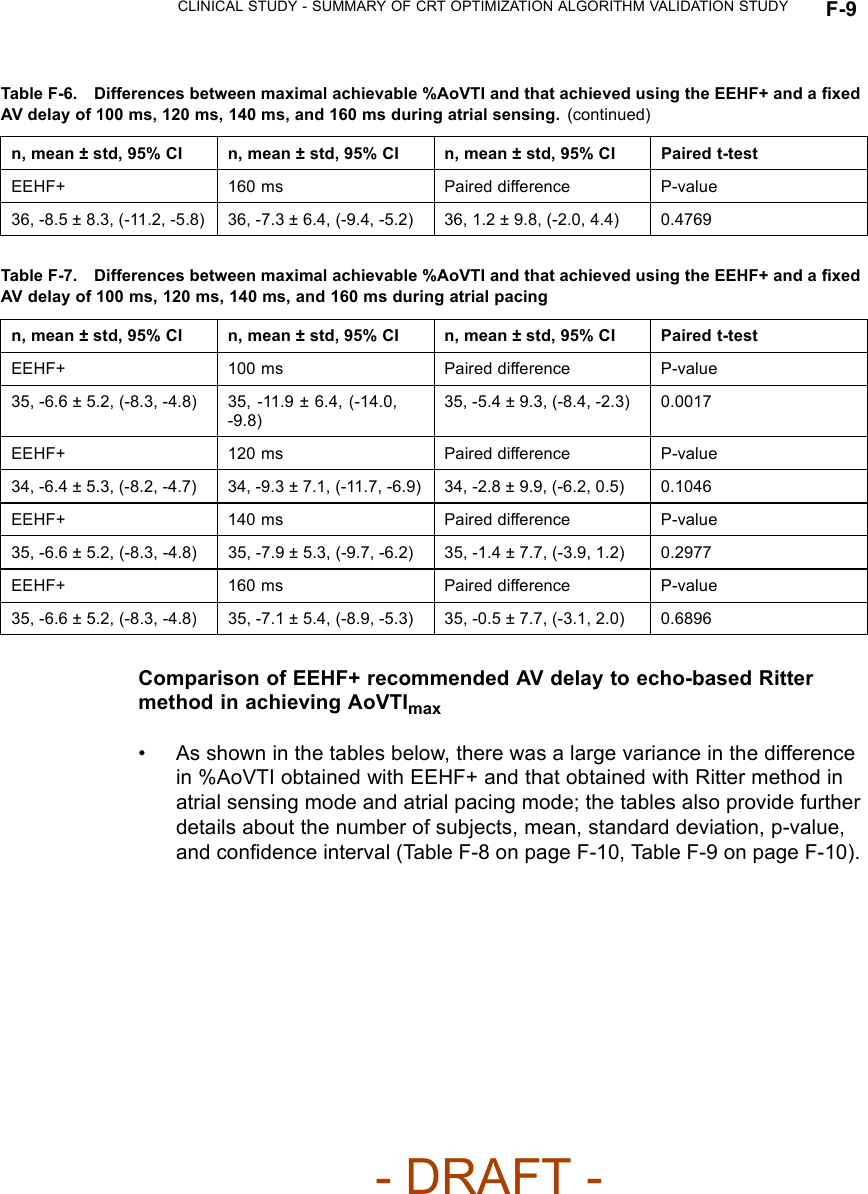
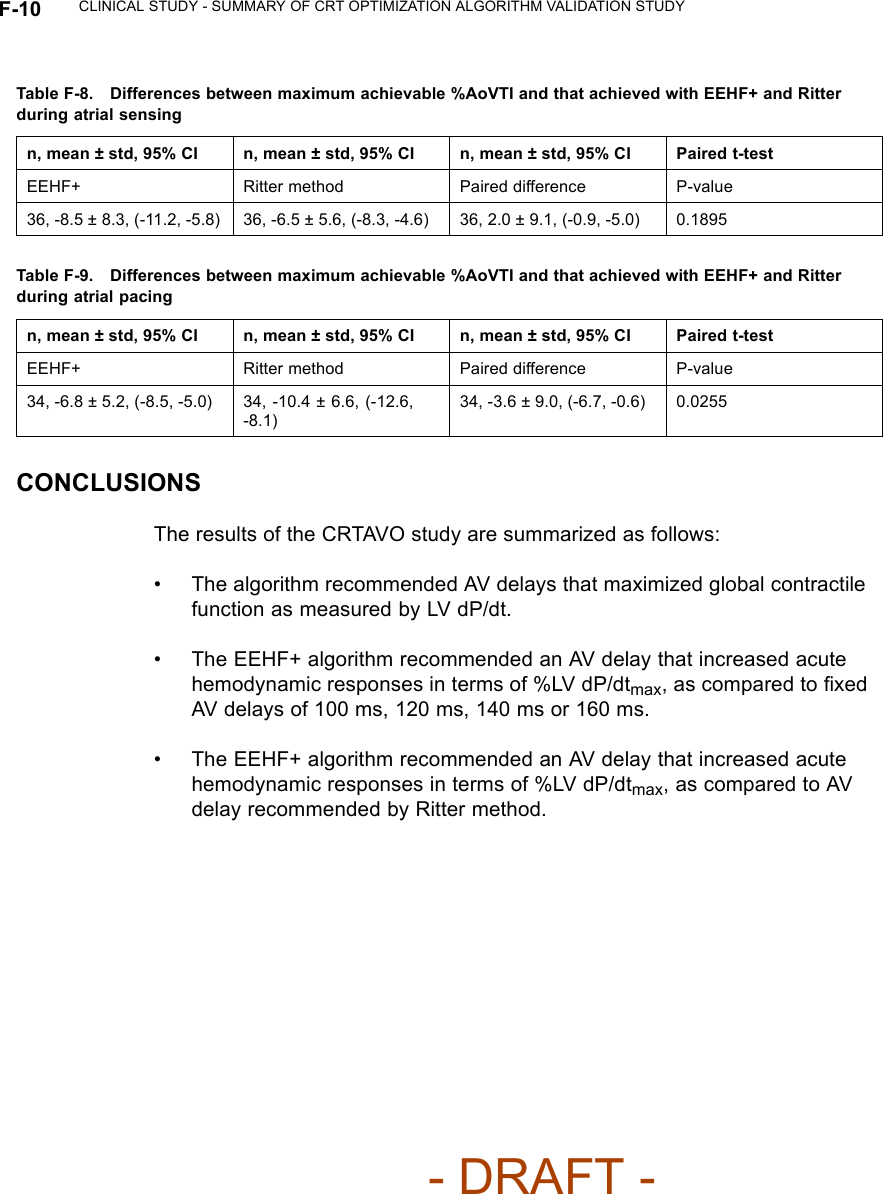
![CLINICAL STUDY - SUMMARY OF CRT OPTIMIZATION ALGORITHM VALIDATION STUDY F-3Table F-1. Subject DemographicsCharacteristic Measurement ResultAge at Implant Number of subjects 50Mean ± SD 68.1 ± 10.5Range [47.0, 85.0]Gender [N (%)] Female 12 (24.0)Male 38 (76.0)NYHA Class [N (%)] II 1(2.0)III 49 (98.0)LVEF Number of subjects 50Mean ± SD 26.6 ± 6.6Range [5.0, 35.0]Conduction Disorder LBBB 38 (86.4)RBBB 12 (27.3)LV DP/dtmax ResultsCorrelation between the LV dP/dtmax at the EEHF+ recommended AVdelay and maximum achievable LV dP/dtmax• For the regression analysis, the 95% confidence intervals of the regressionslope were [0.98, 1.07] and [0.94, 1.10] for atrial sensing and pacing. Thecorresponding intercept values were [-2.07, -0.86] and [-3.73, -0.76] foratrial sensing and pacing (Figure F-1 on page F-4). The ability of EEHF+ tosuggest an AV delay that maximizes %LV dP/dtmax for both atrial sensingand atrial pacing is demonstrated in the regression plots. For patientswith a near-zero maximum improvement in %LV dP/ dtmax from baseline,the %LV dP/dtmax at the AV delay estimated by EEHF+ was close to themaximum achievable %LV dP/dtmax as indicated by the small intercept(-1.47 for atrial sensing and -2.25 for atrial pacing).- DRAFT -](https://usermanual.wiki/Boston-Scientific/CRMN11906.Cognis-Part-4-Manual/User-Guide-886099-Page-87.png)
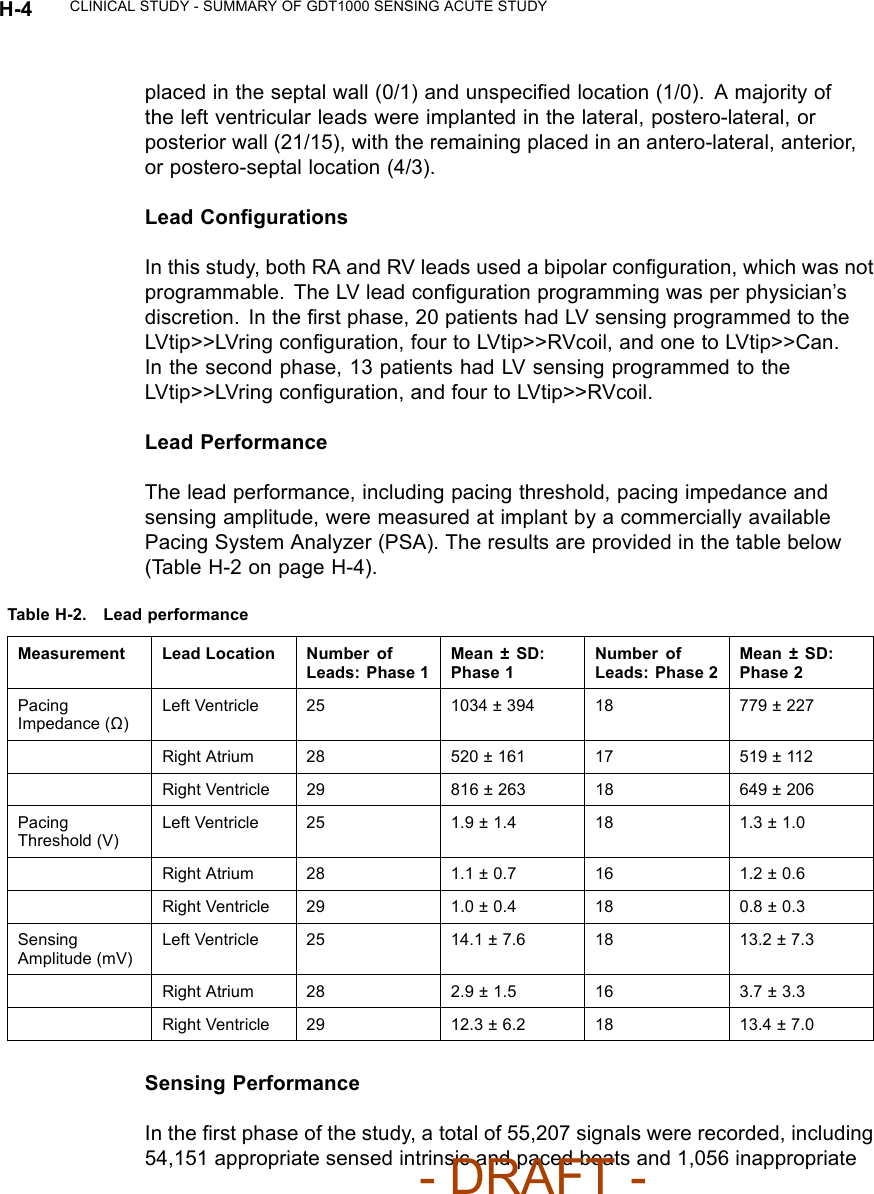
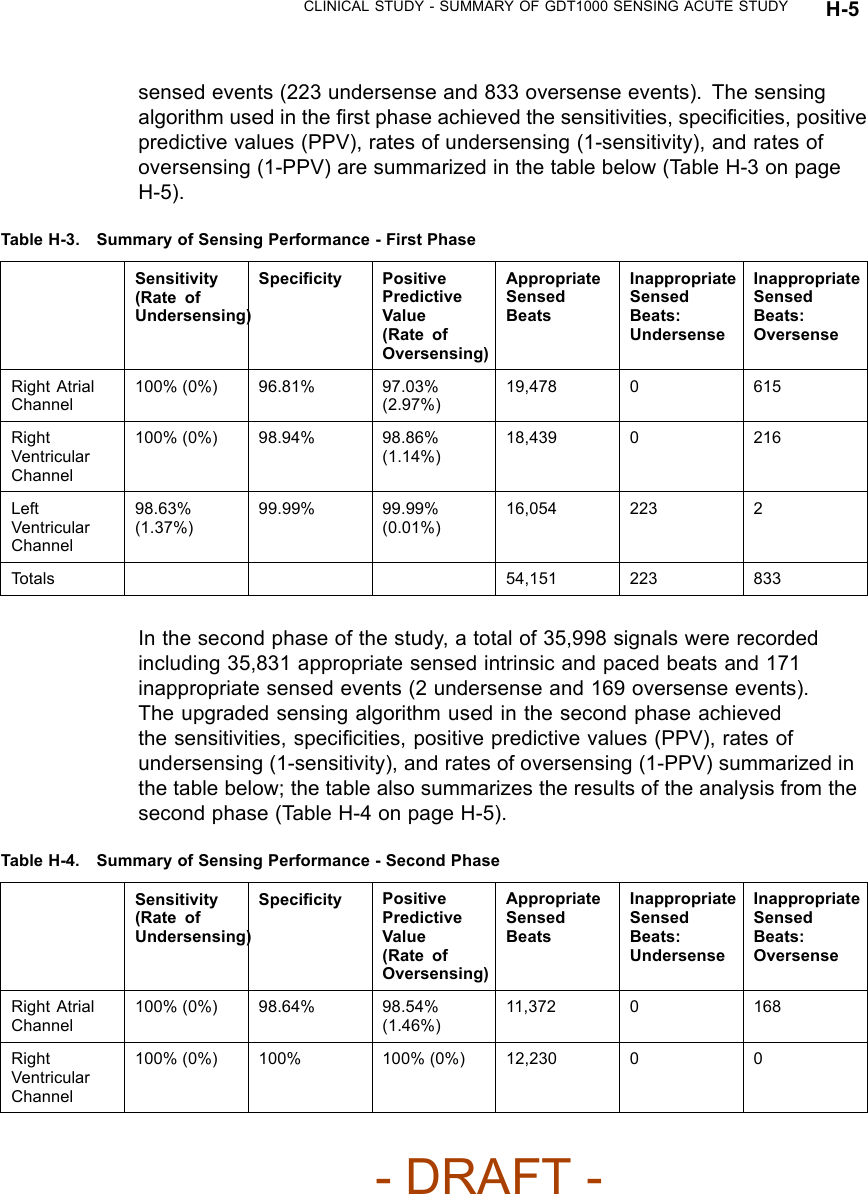
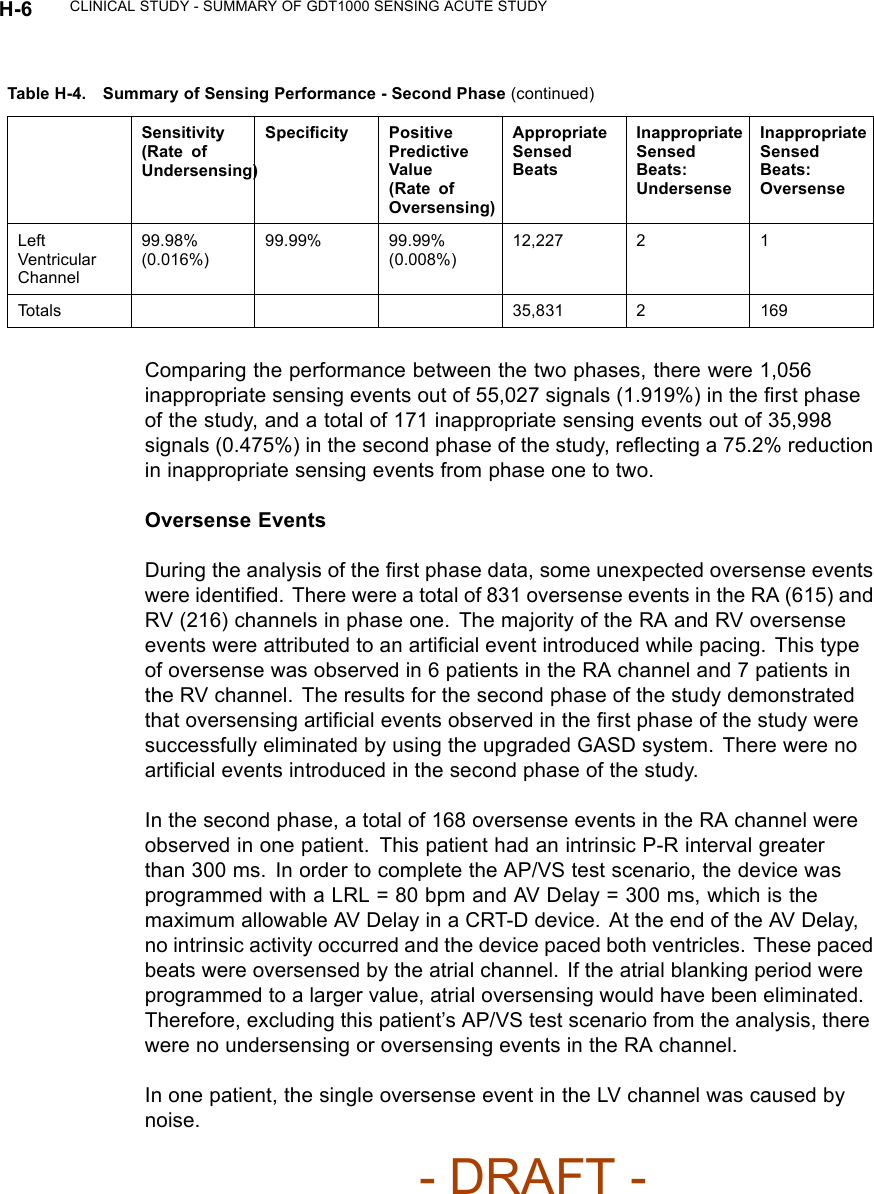
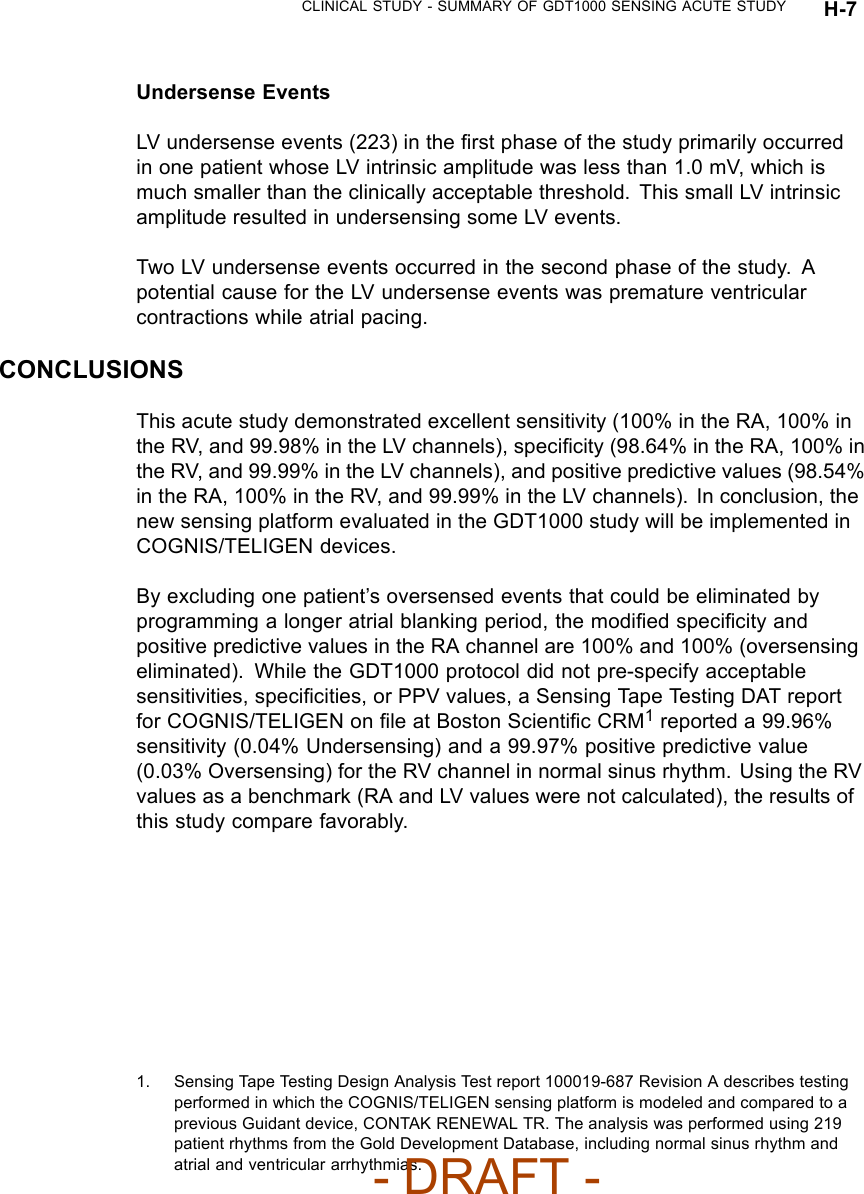
![CLINICAL STUDY - SUMMARY OF GDT1000 SENSING ACUTE STUDY H-3STUDY RESULTSPatient CharacteristicsThe table below shows the characteristics of the patients implanted orattempted (Table H-1 on page H-3).Table H-1. All patients implanted or attempted, Phase 1 and Phase 2Characteristic Measurement Phase 1 Result (N=29) Phase 2 Result (N=19)Age at implant Mean ± SD 65.8 ± 12.2 68.1 ± 9.6Range [44.6, 85.5] [51.3, 81.8]Gender [N (%)] Female 14 (48.0) 14 (74.0)Male 15 (52.0) 5 (26.0)NYHA Class [N (%)] III 27 (93) 19 (100)IV 2(7) 0(0)LVEF (%) Mean ± SD 22.4 ± 7.7 23.5 ± 6.4Range [10.0, 35.0] [15.0, 35.0]QRS Duration Mean ± SD 161± 29 149± 30Range [124, 248] [106, 220]Cardiac Disease [N (%)] NonischemicCardiomyopathy14 (48) 7 (37)Ischemic Cardiomyopathy,CAD10 (34) 9 (47)Hypertension 3(10) 0(0)Coronary Artery Disease(CAD)1(3) 0(0)Ischemic Cardiomyopathy,no CAD1 (3) 3 (16)Valvular Heart Disease 0(0) 1(5)Other 0 (0) 1 (5)Lead PositionIn this study, the position of each lead was per physician’s discretion. A majorityof the atrial leads in the first/second phase of the study were placed in theright atrial appendage (19/12) with the remaining placed in the lateral wall(5/2), septal wall (2/3), and unspecified location (1/0). A majority of the rightventricular leads were implanted in the right ventricular apex, with the remaining- DRAFT -](https://usermanual.wiki/Boston-Scientific/CRMN11906.Cognis-Part-4-Manual/User-Guide-886099-Page-101.png)