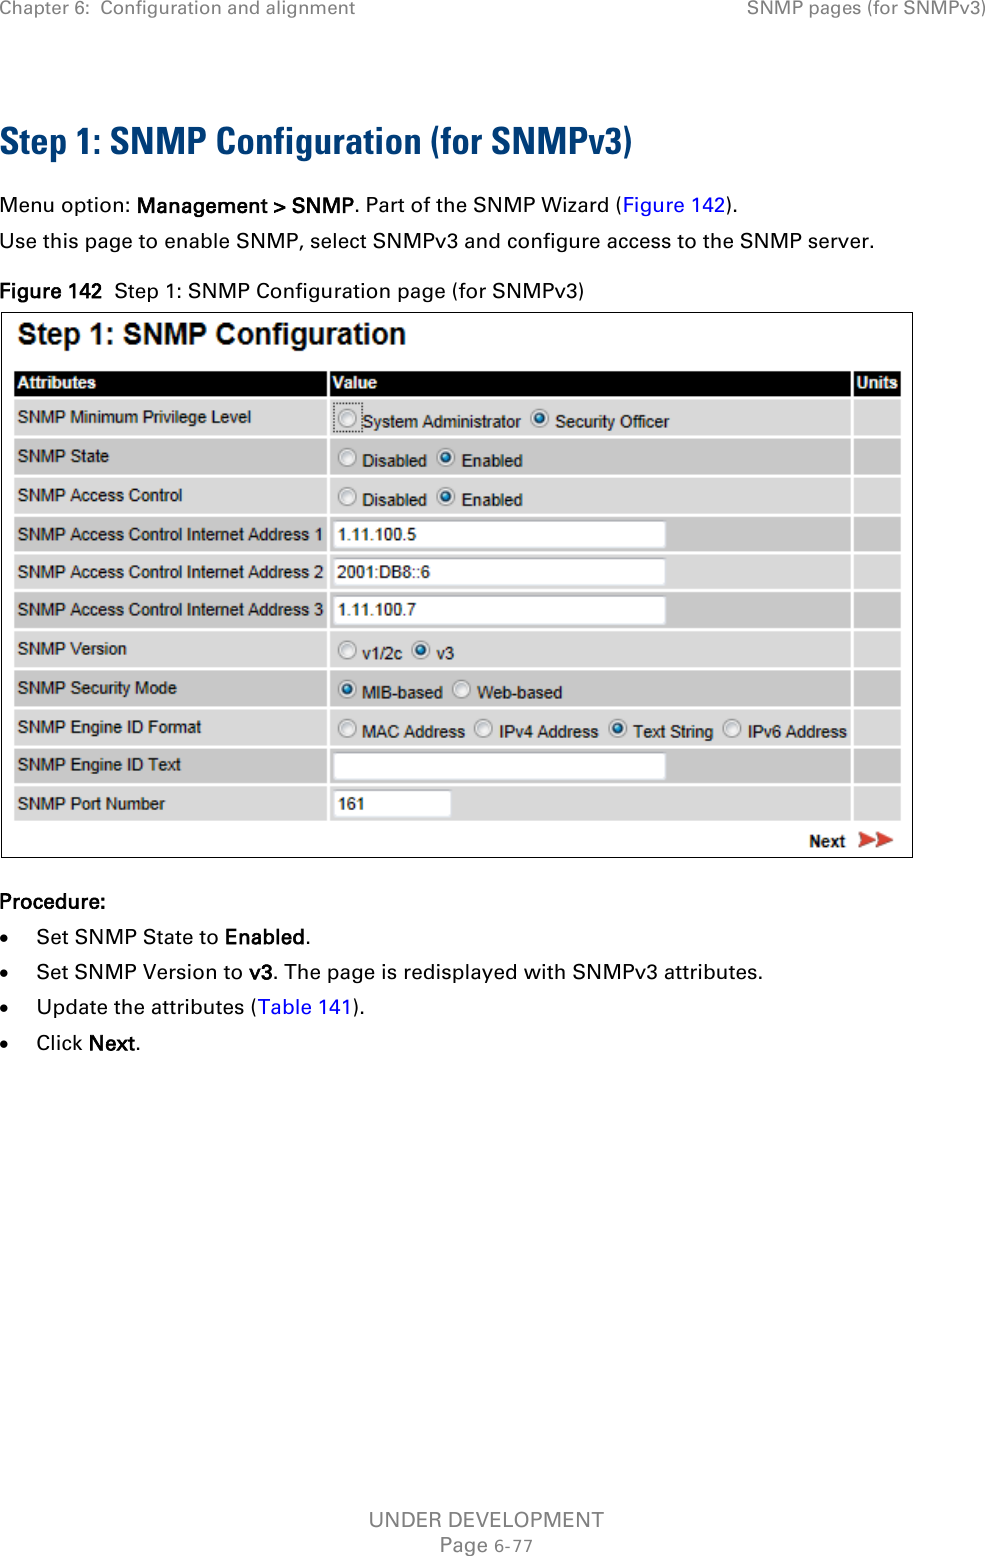
Cambium Networks 50650 Wireless Ethernet Bridge User Manual PTP 650 Series User Guide
Cambium Networks Limited Wireless Ethernet Bridge PTP 650 Series User Guide
UserManual.wiki
>
Cambium Networks
>
50650 User Manual
>
User Guide Part 3
Contents
1.
User Manual Part 1
2.
User Manual Part 2
3.
Installation Guide
4.
User Guide Part 1
5.
User Guide Part 2
6.
User Guide Part 3
User Guide Part 3
Navigation menu
Upload a User Manual
Namespaces
Wiki Guide
HTML
PDF
Info
Views
User Manual
Discussion / Help
Navigation
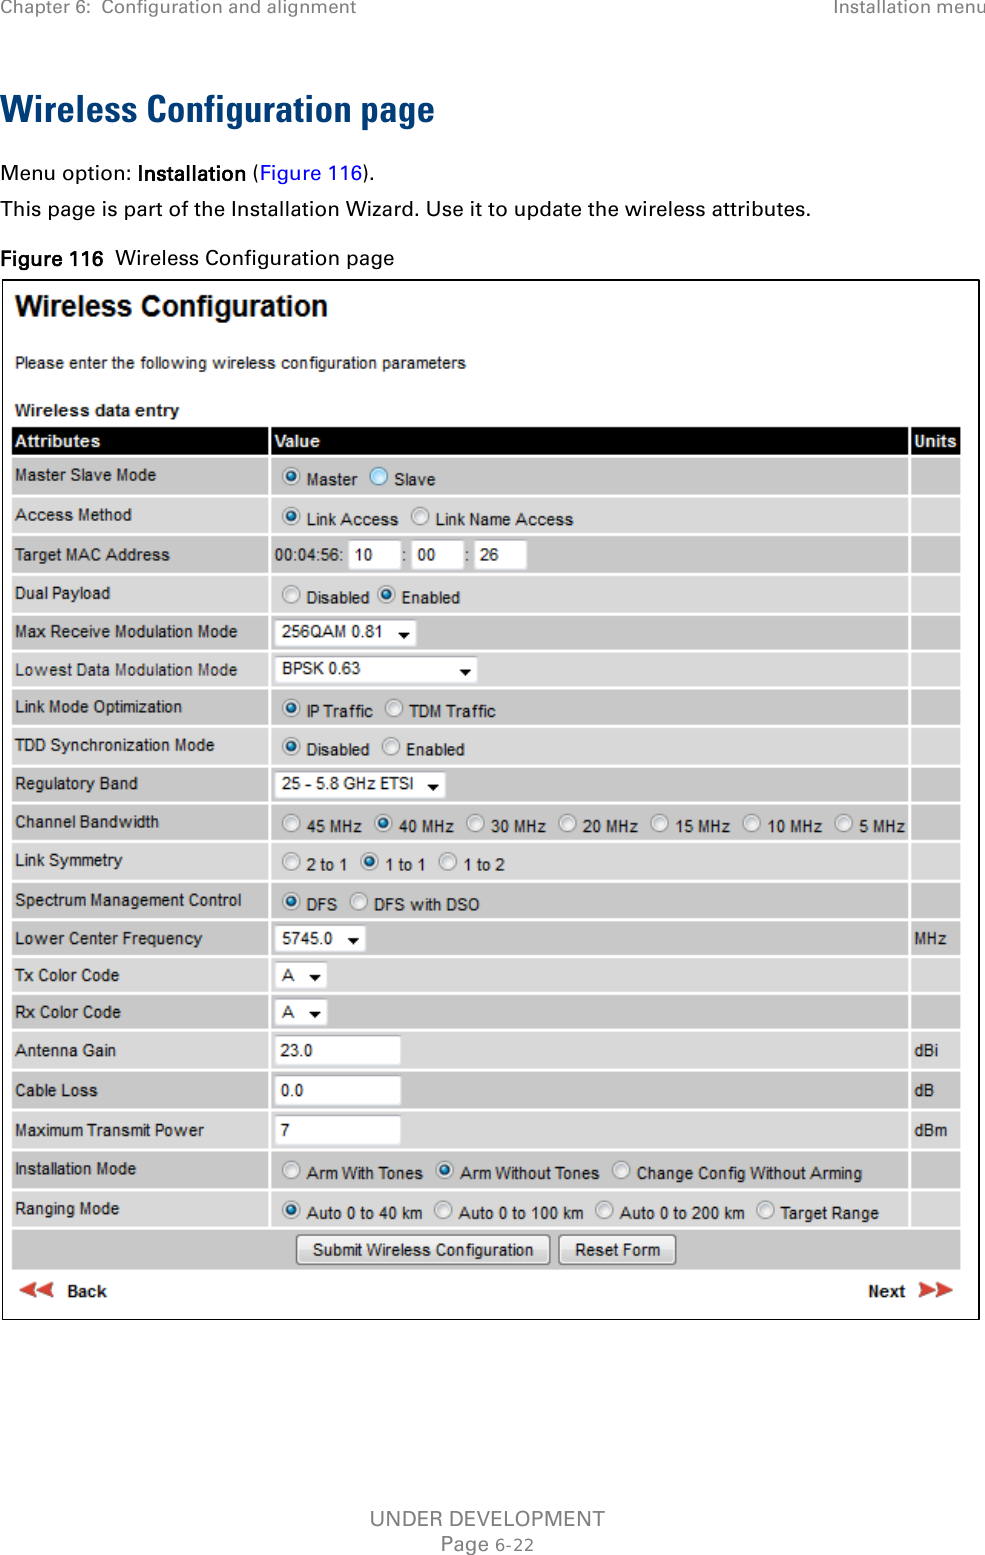
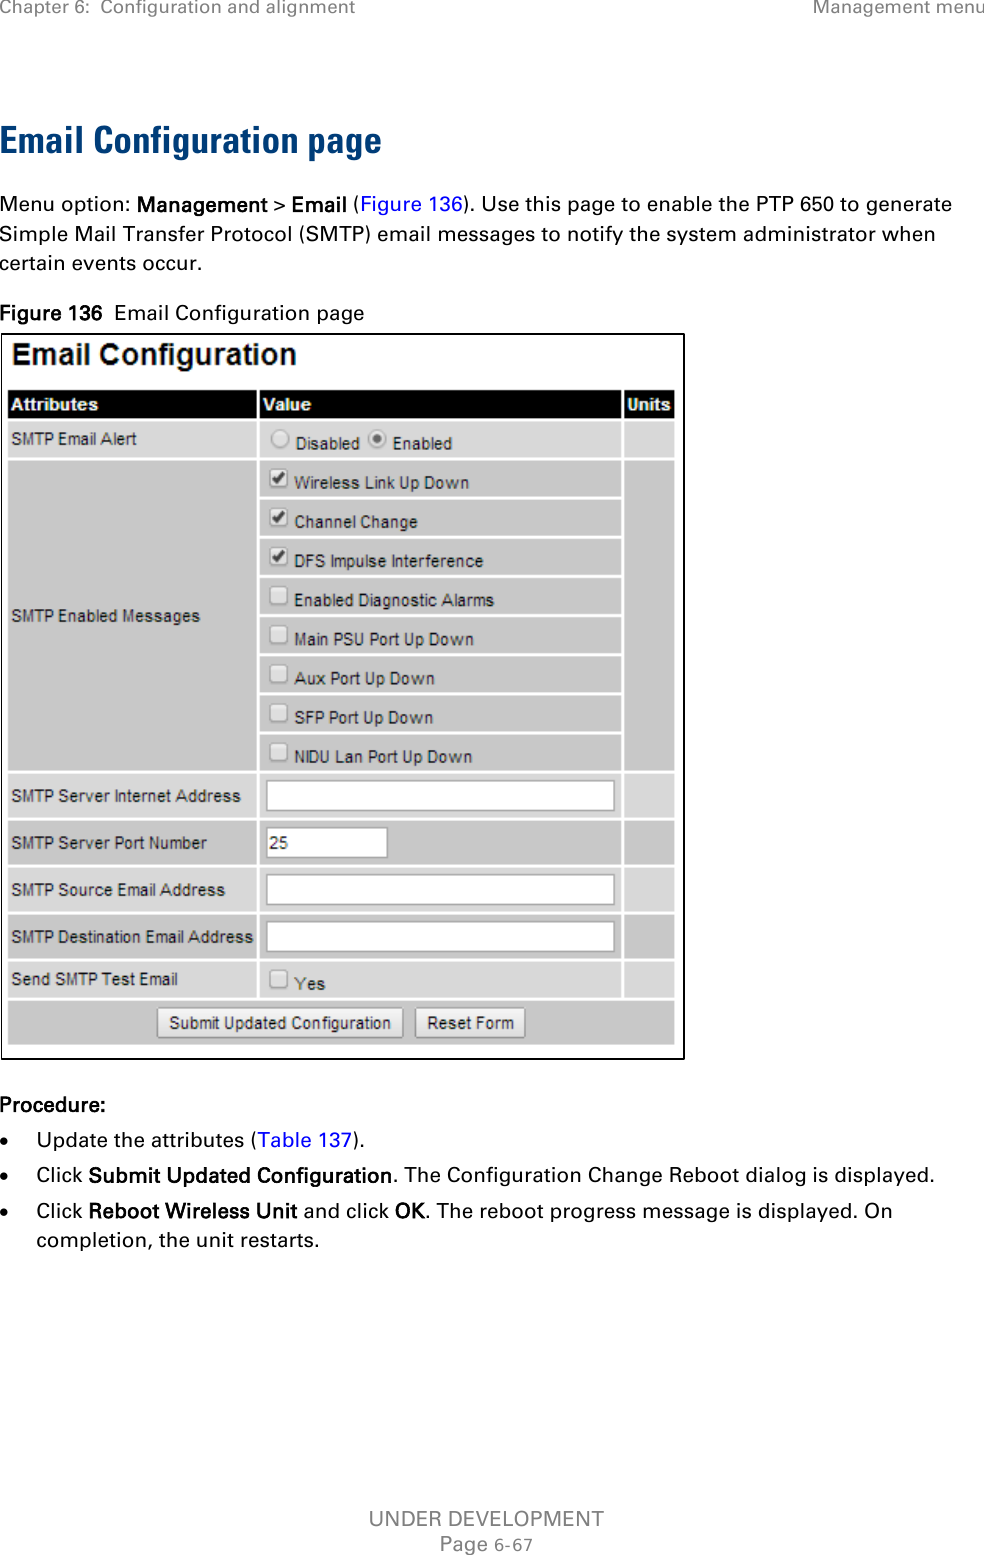
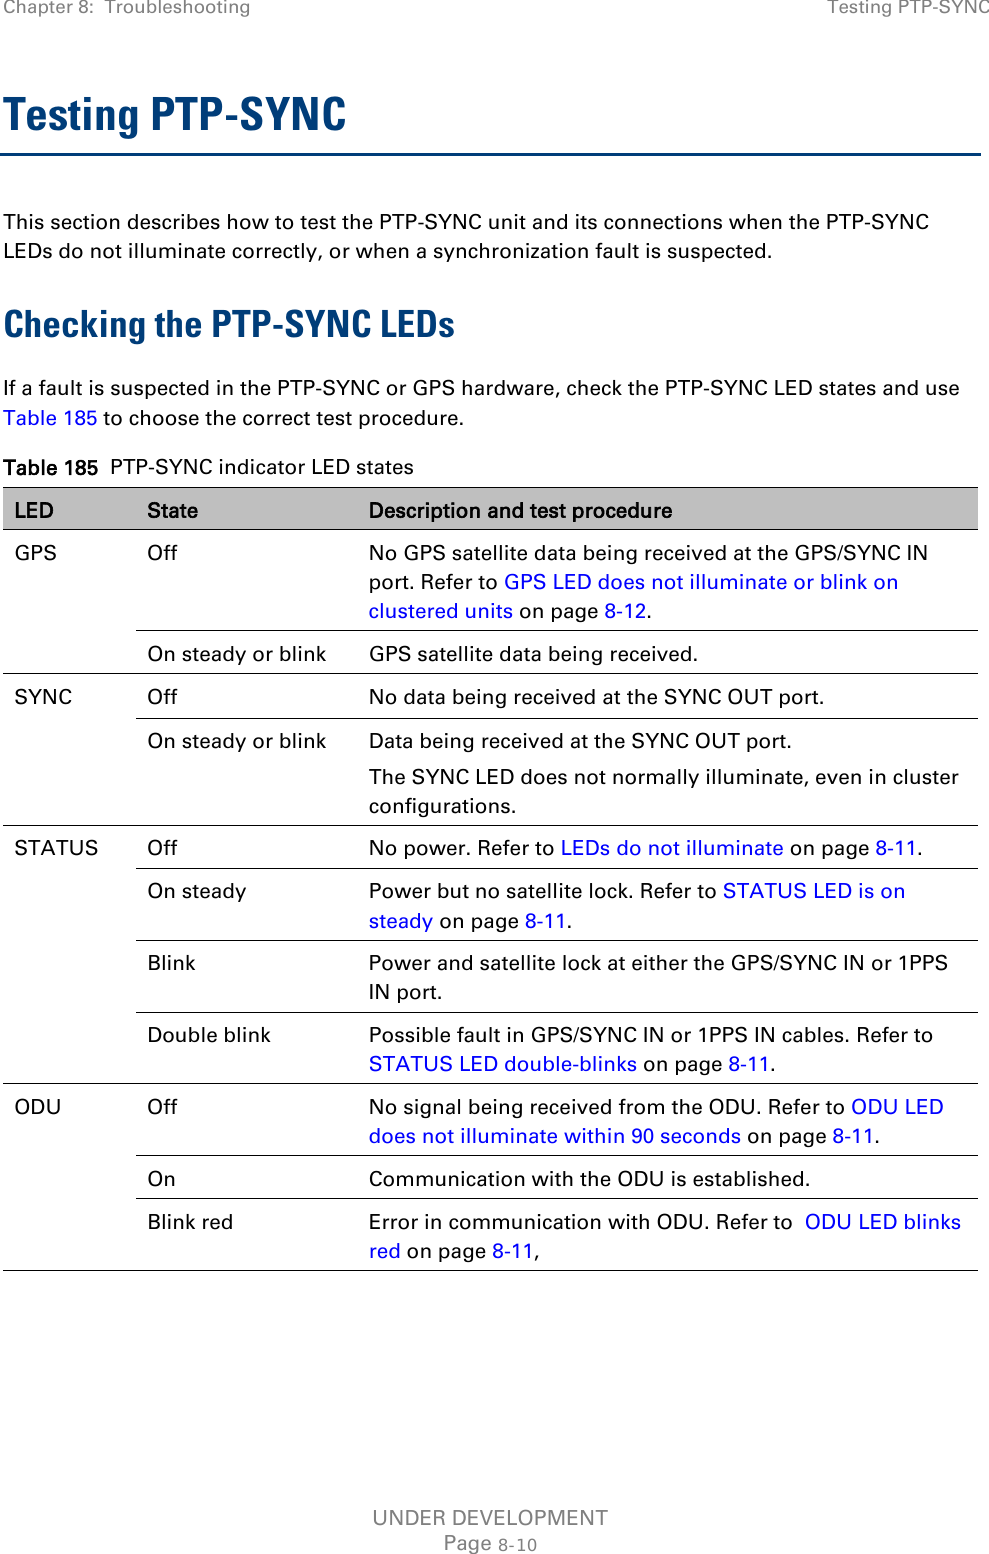
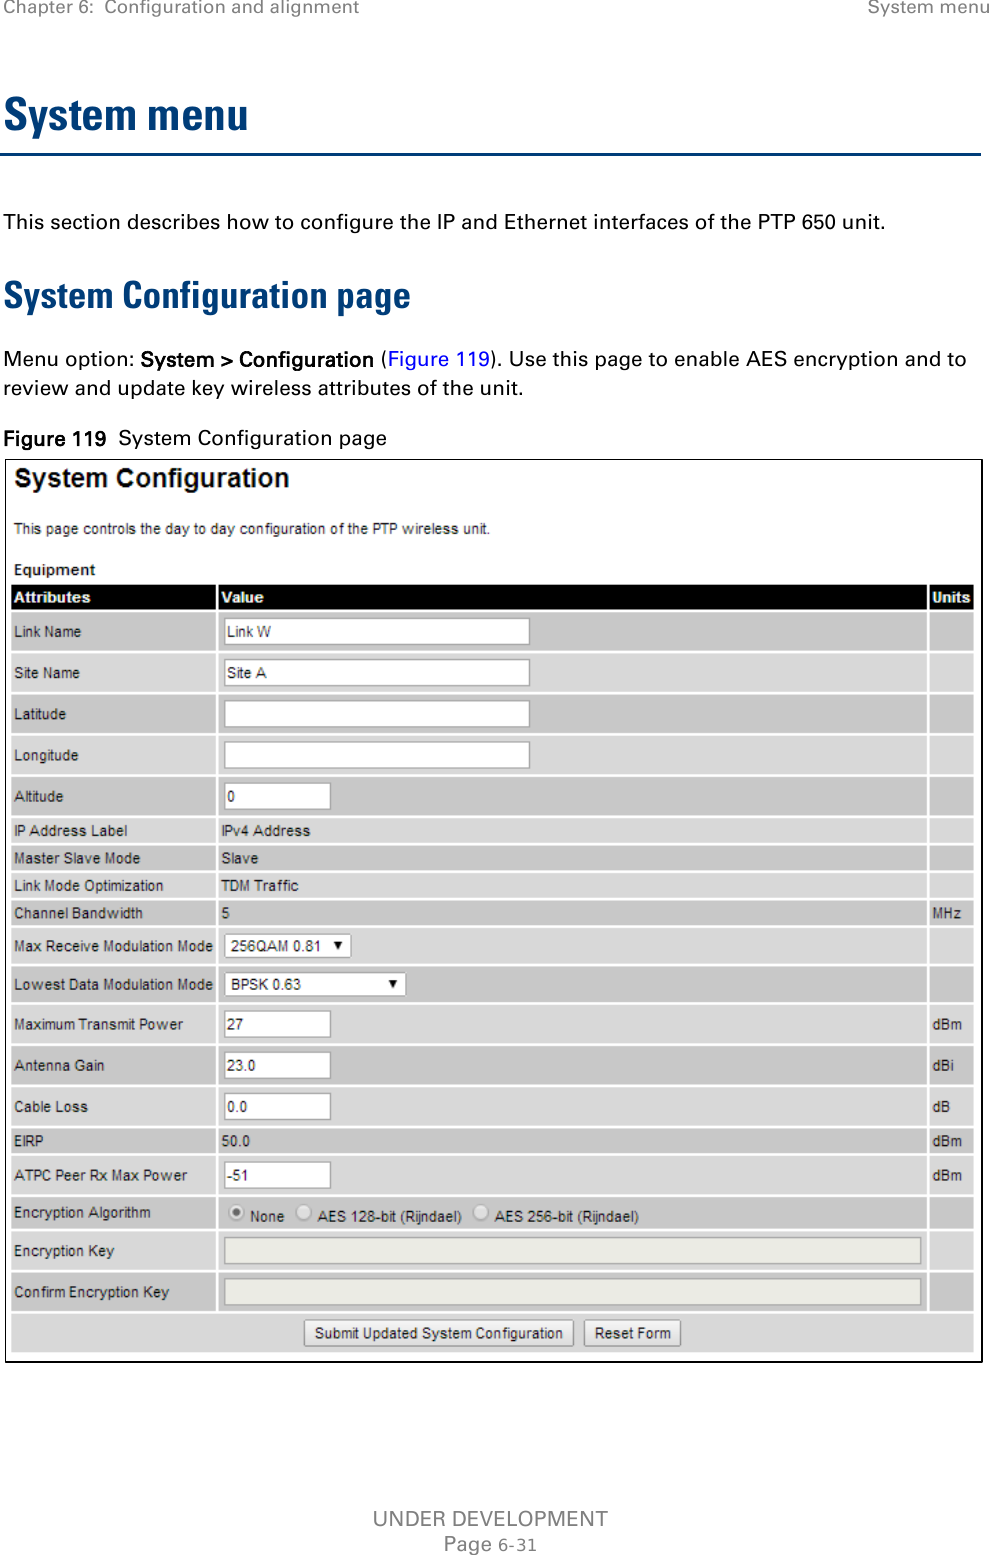
![Chapter 6: Configuration and alignment Installation menu Attribute Meaning Link Name Only displayed when Access Method is set to Link Name Access. Link Name may consist of letters (A-Z and a-z), numbers (0-9), spaces, and the following special characters: (),-.,:<=>[]_{} Link Name must be same at both ends and different to site name. Group Id Only displayed when Access Method is set to Group Access. A link can only be established between units that have identical Group IDs. Dual Payload Disabled: The link maximizes robustness against fading and interference. Enabled: The link attempts to reach maximum throughput at the expense of robustness against fading and interference. Max Receive Modulation Mode The maximum mode the unit will use as its adaptive modulation. By default the Max Receive Modulation Mode is the highest mode available. For minimum error rates, set the maximum modulation mode to the minimum necessary to carry the required traffic. Lowest Data Modulation Mode The lowest modulation mode that must be achieved before the link is allowed to bridge customer data Ethernet frames. This does not affect the bridging of management data: if out-of-band remote management is enabled, this will continue regardless of modulation mode. Link Mode Optimization IP Traffic: The link is optimized for IP traffic to provide the maximum possible link capacity. TDM Traffic: The link is optimized for TDM traffic to provide the lowest possible latency. This is the only available setting when TDM is enabled (Interface Configuration page on page 6-14). TDD Synchronization Mode Disabled: The link does not employ TDD synchronization. Enabled: The link employs TDD synchronization. This is configured in the Installation Wizard; see TDD synchronization page (optional) on page 6-28. For a basic description, see TDD synchronization on page 1-19. When TDD Synchronization Mode is set to Enabled, the following restrictions apply: Ranging Mode and Target Range are disabled, and Link Symmetry is limited to 1 to 1. Regulatory Band The regulatory band selected from the list in the license key. Channel Bandwidth Bandwidth of the transmit and receive radio channels. UNDER DEVELOPMENT Page 6-24](https://usermanual.wiki/Cambium-Networks/50650.User-Guide-Part-3/User-Guide-2331814-Page-24.png)
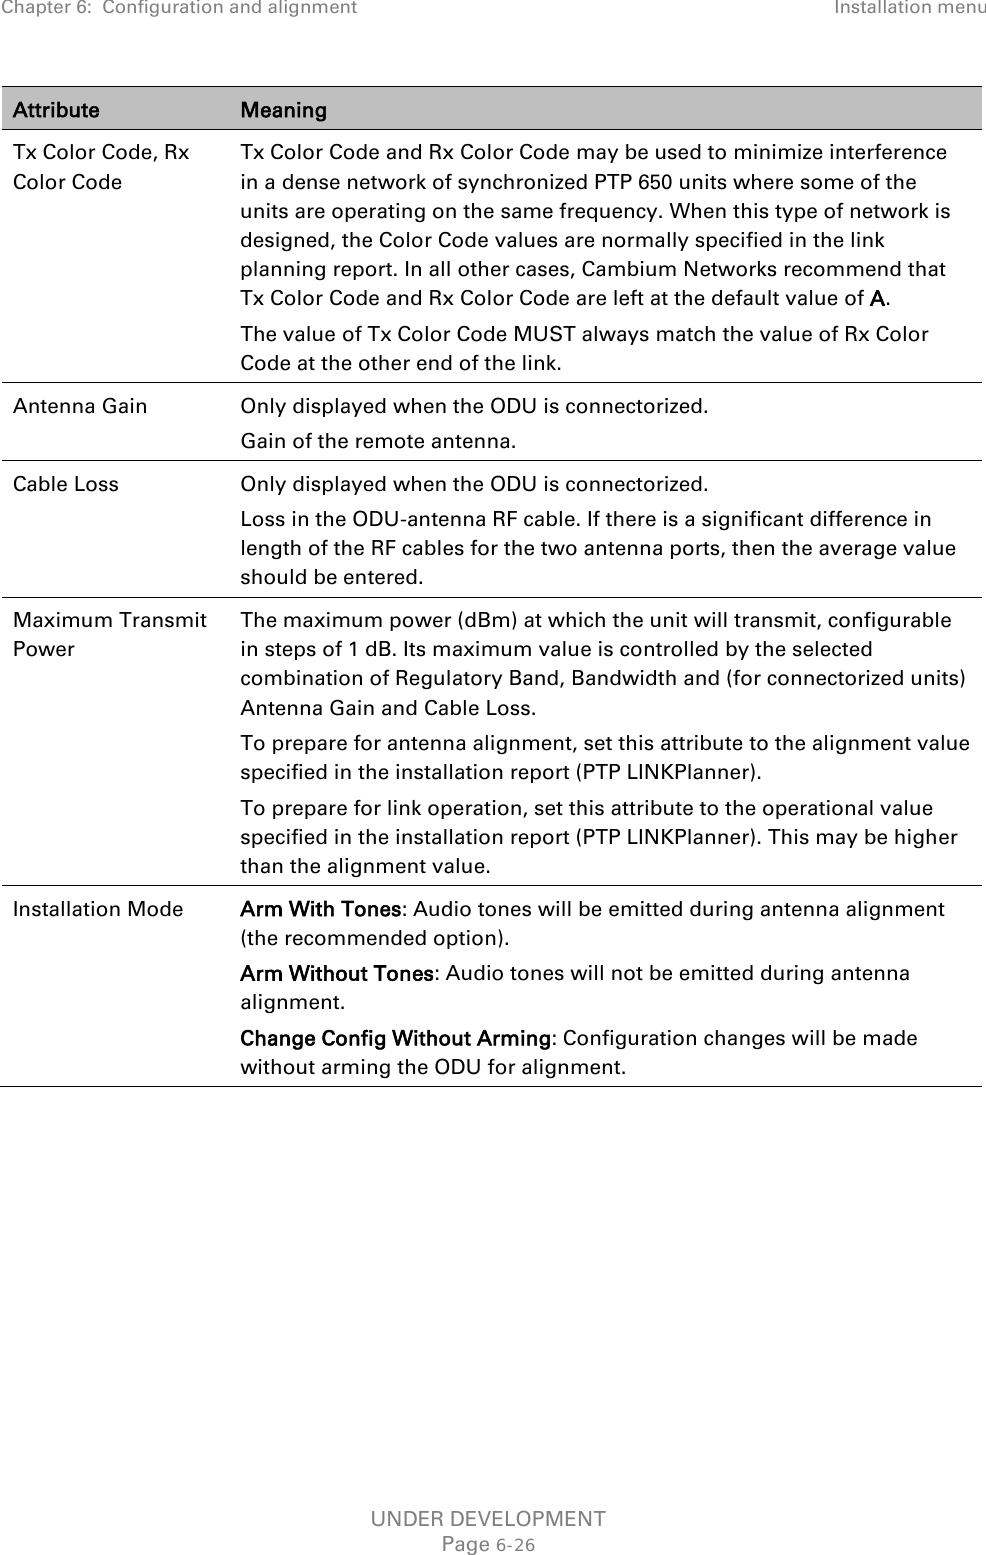
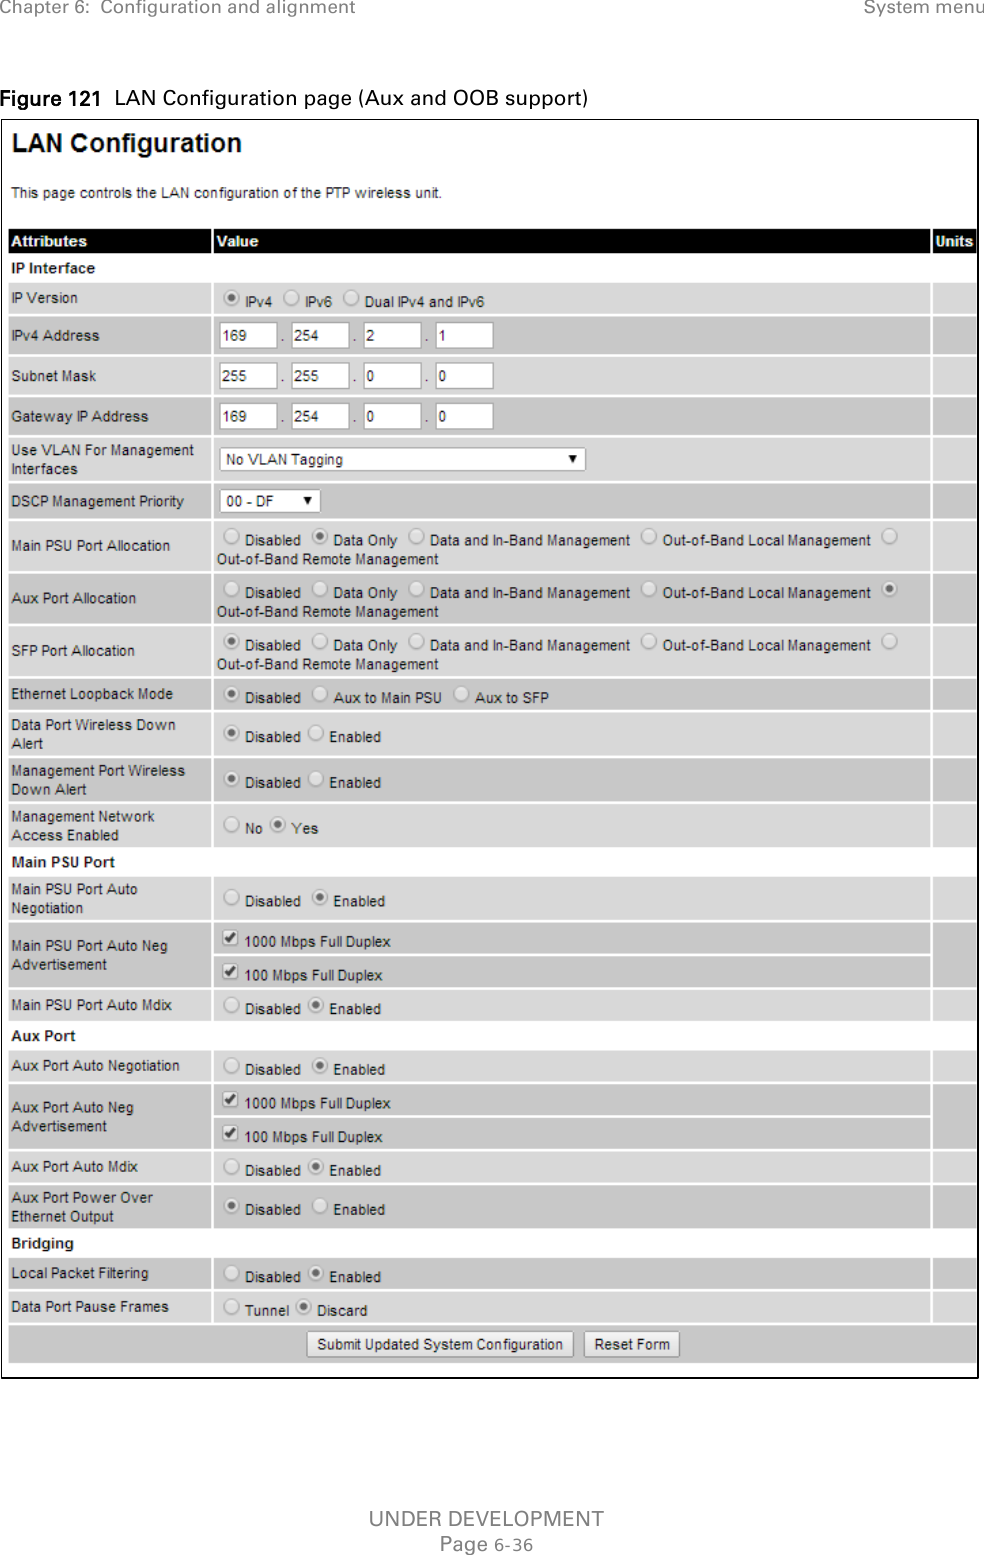
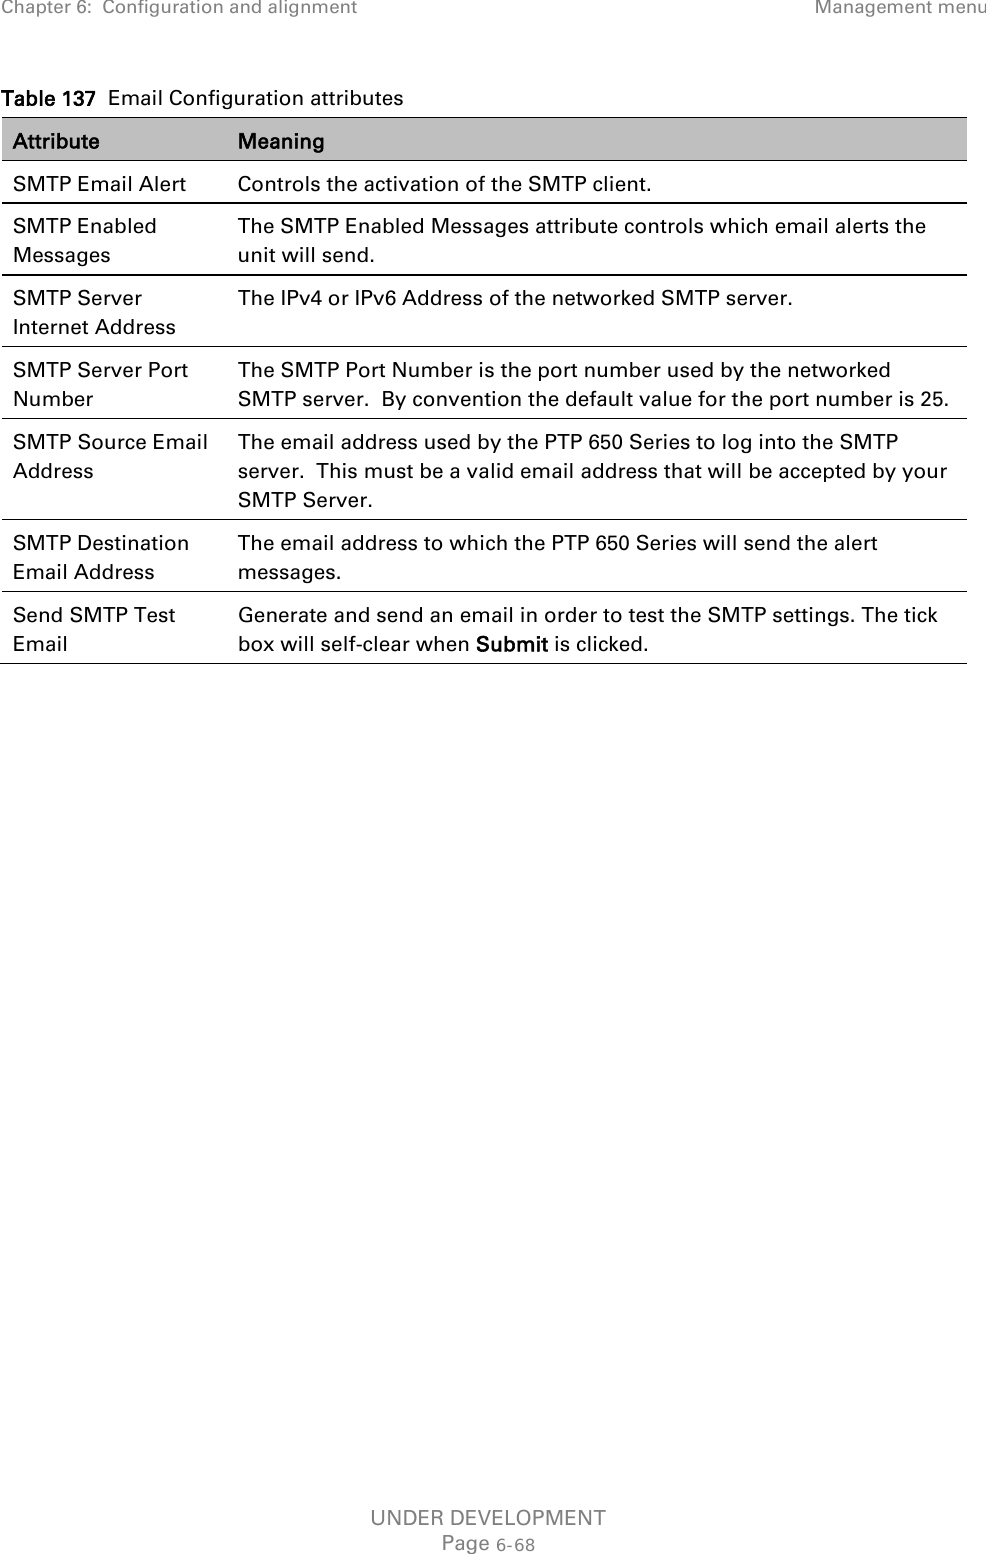
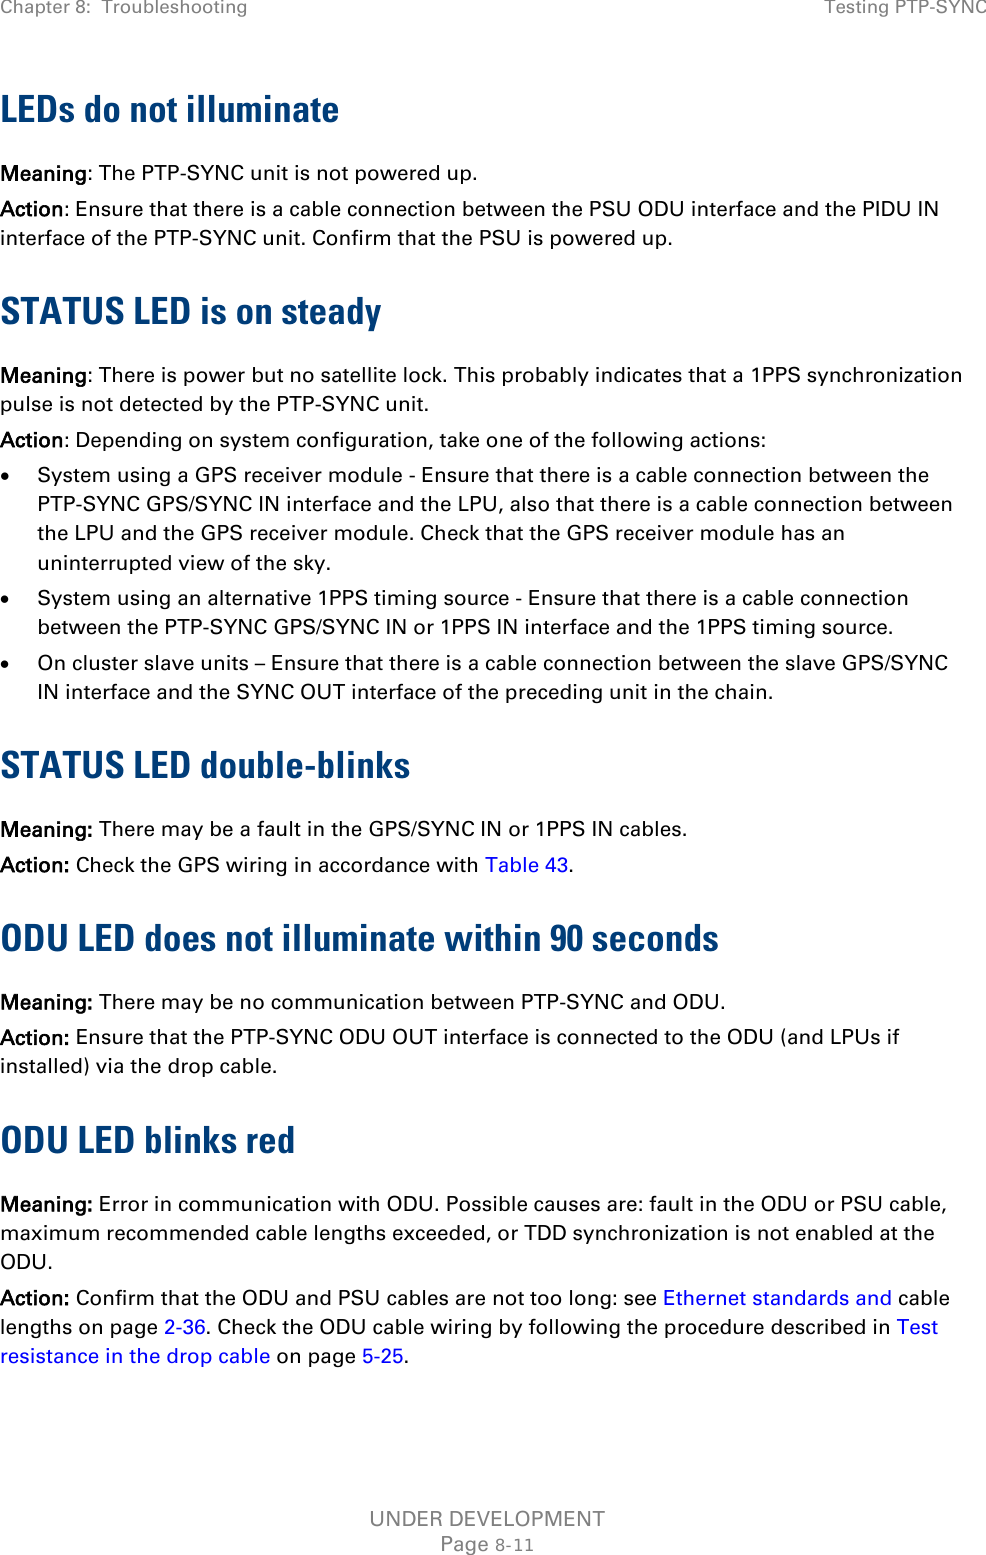
![Chapter 6: Configuration and alignment System menu If the ODU is a Master unit and Transmitter Mute Control is enabled (Webpage Properties page on page 6-64), the Mute Transmitter control is displayed at the top of this page (Figure 120). Figure 120 Mute Transmitter control in System Configuration page Caution Configuring link encryption over an operational link will necessitate a service outage. Therefore, the configuration process should be scheduled during a period of low link utilization. Procedure: • If AES encryption is required but the System Configuration page does not contain the Encryption Algorithm or Encryption Key attributes, then order the necessary AES capability upgrade, generate a license key and enter it on the Software License Key page (Software License Key page on page 6-11). • Update the attributes (Table 121). • To save changes, click Submit Updated System Configuration. • If a reboot request is displayed, click Reboot Wireless Unit and OK to confirm. Table 121 System Configuration attributes Attribute Meaning Transmitter Only displayed when the ODU is a Master unit and Transmitter Mute Control is enabled. Use the Mute Transmitter control to toggle between Muted and Enabled. Muted: The ODU will not radiate and will not forward Ethernet frames between the wireless interface and the Ethernet ports. Enabled: The ODU is allowed by the user to radiate and will forward Ethernet frames between the wireless interface and the Ethernet ports. Link Name Link Name may consist of letters (A-Z and a-z), numbers (0-9), spaces, and the following special characters: (),-.,:<=>[]_{}. Link Name must be same at both ends and different to site name. Site Name User defined name for the site, with additional notes (if required). Latitude The latitude of the ODU, measured in decimal degrees. This attribute has no internal function. UNDER DEVELOPMENT Page 6-32](https://usermanual.wiki/Cambium-Networks/50650.User-Guide-Part-3/User-Guide-2331814-Page-32.png)