GE Medical Systems Information Technologies 2014748-002 Medical Telemetry Transmitter User Manual
GE Medical Systems Information Technologies Inc. Medical Telemetry Transmitter
UserManual.wiki
>
GE Medical Systems Information Technologies
>
2014748-002 User Manual
>
Manual Draft1 Part 7
Contents
1.
Manual Draft2 Excerpt
2.
Manual Draft1 Part 1
3.
Manual Draft1 Part 2
4.
Manual Draft1 Part 3
5.
Manual Draft1 Part 4
6.
Manual Draft1 Part 5
7.
Manual Draft1 Part 6
8.
Manual Draft1 Part 7
Manual Draft1 Part 7
Navigation menu
Upload a User Manual
Namespaces
Wiki Guide
HTML
PDF
Info
Views
User Manual
Discussion / Help
Navigation
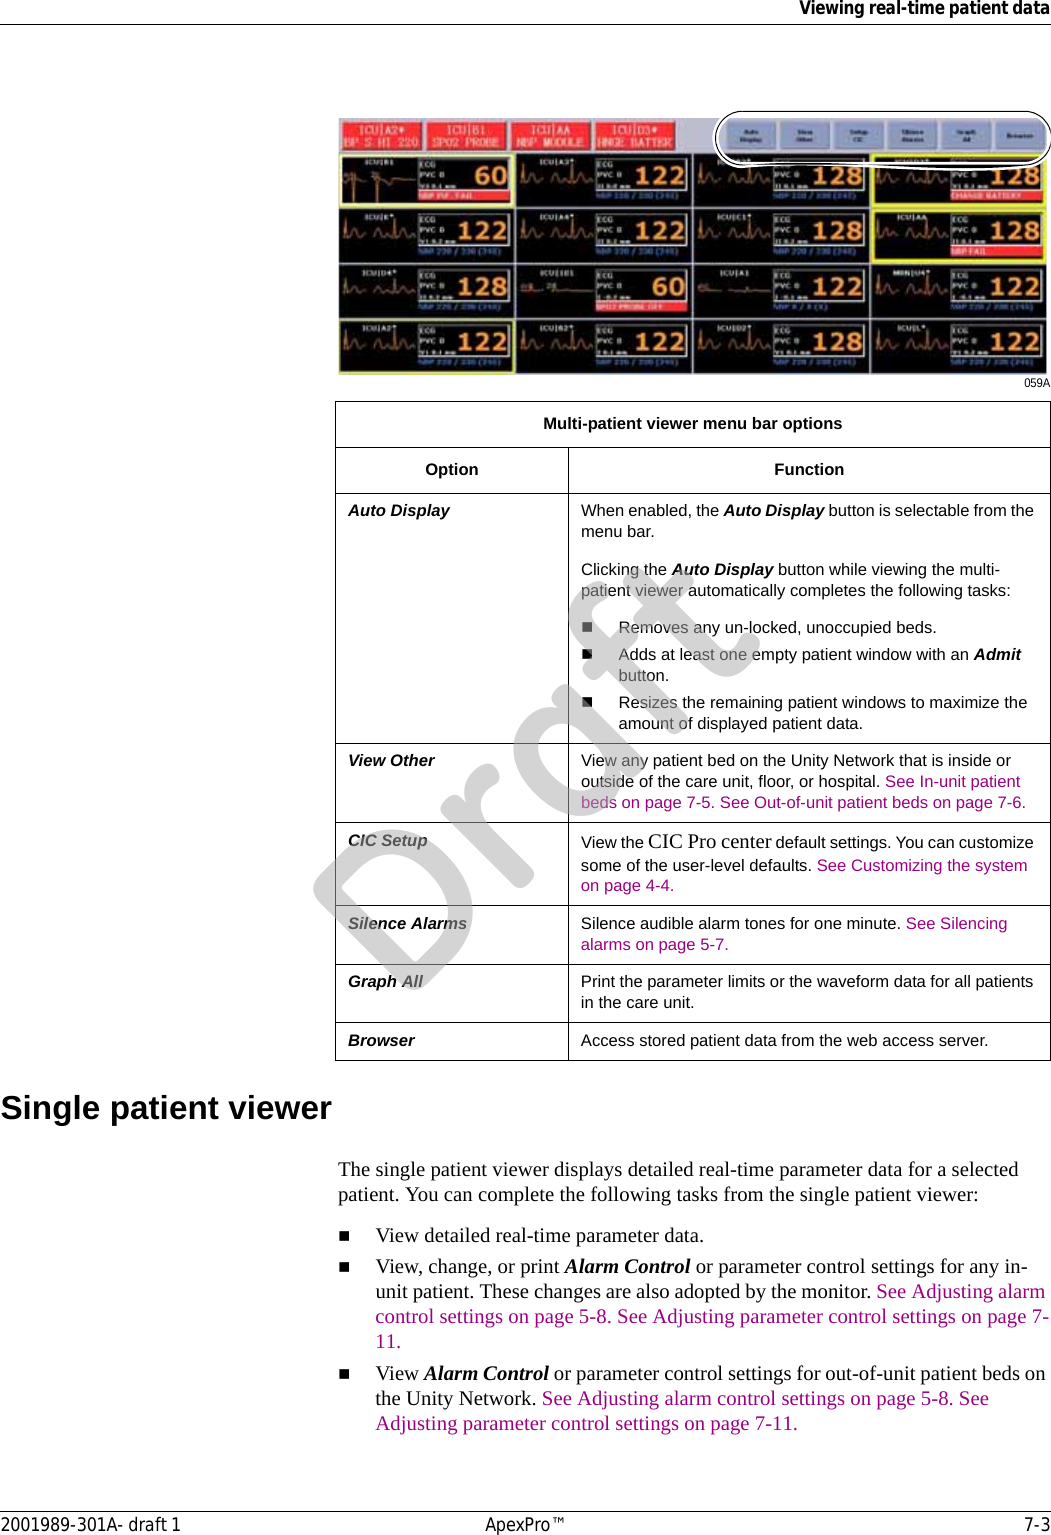
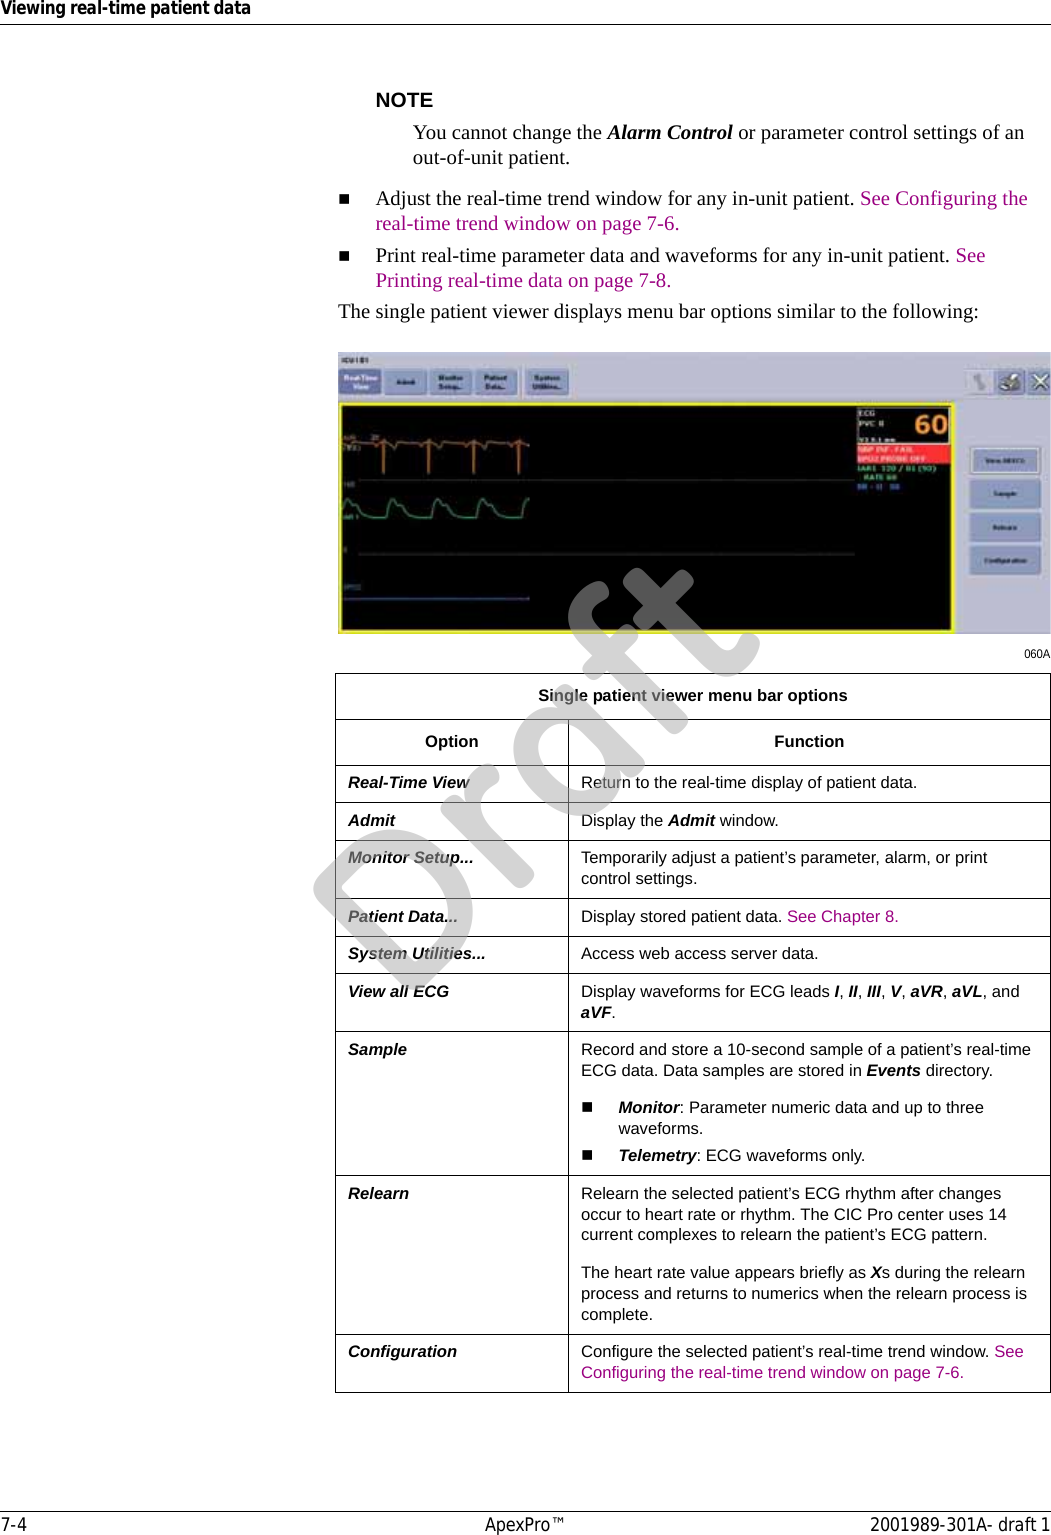
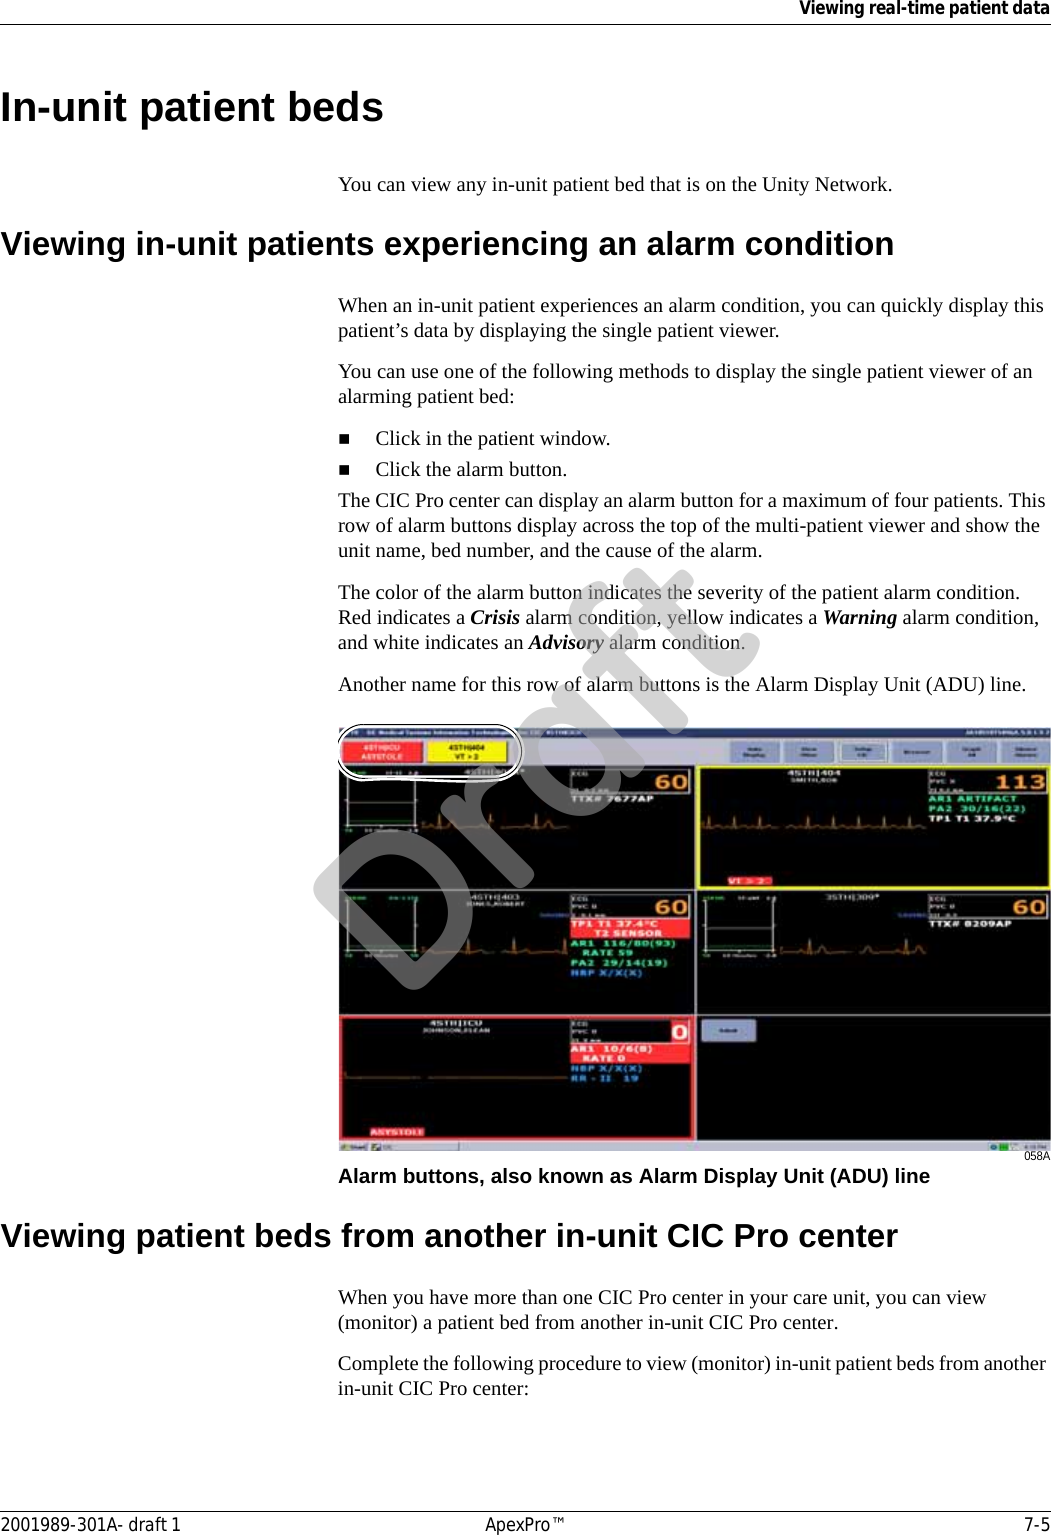

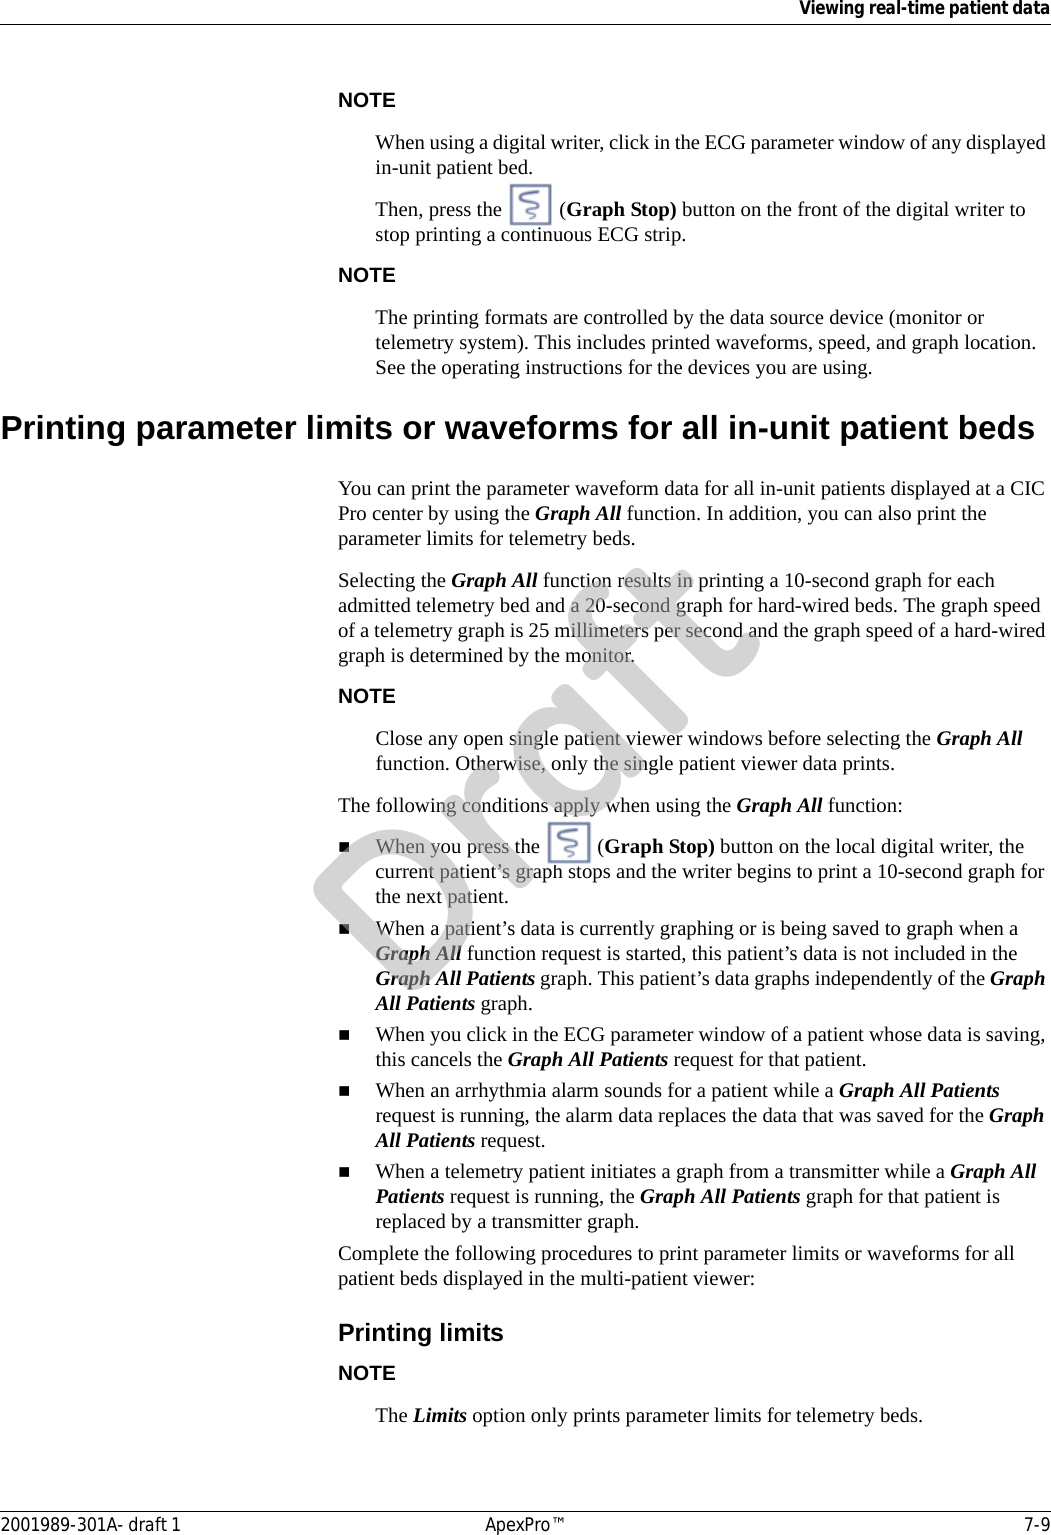
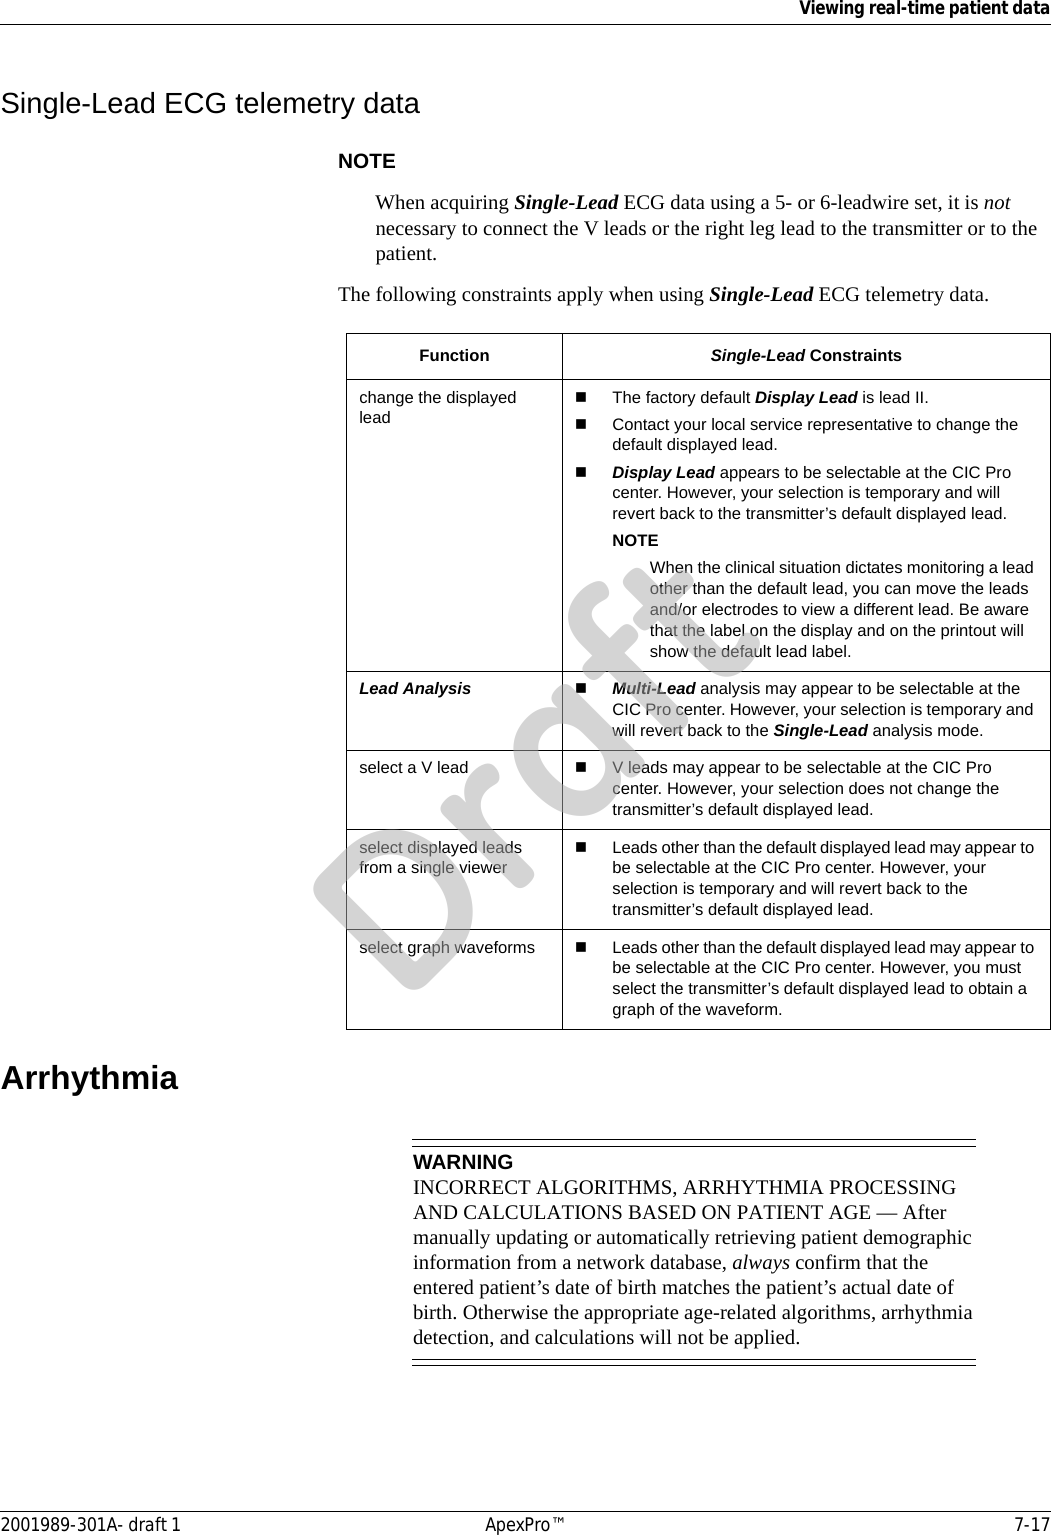
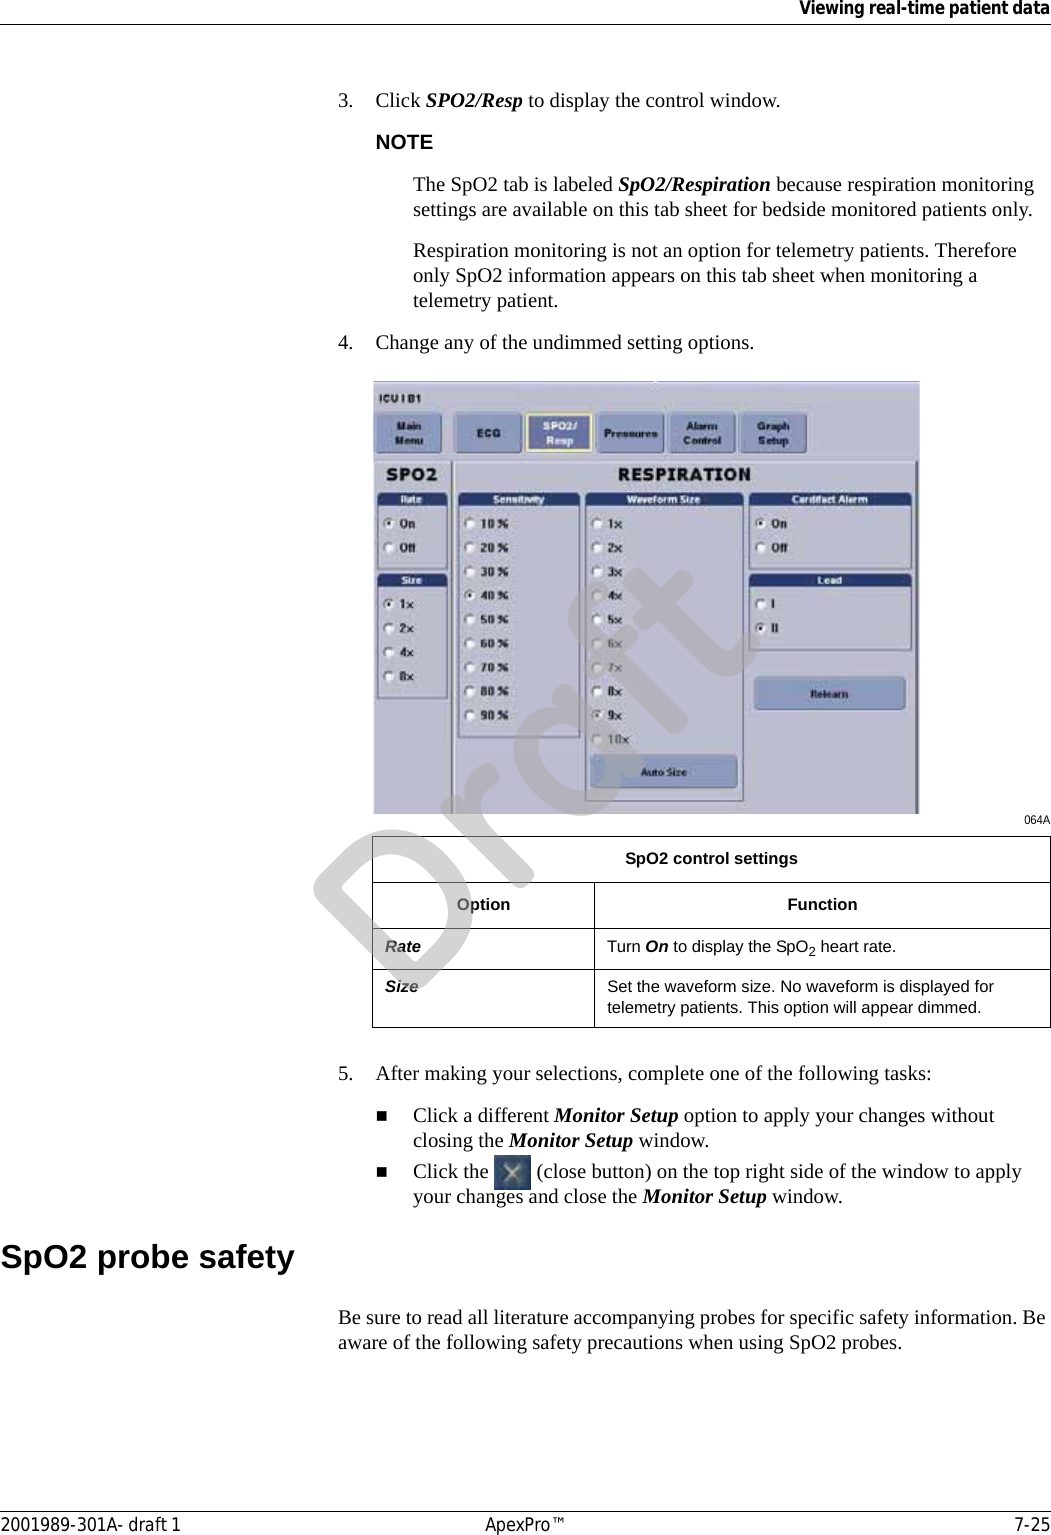
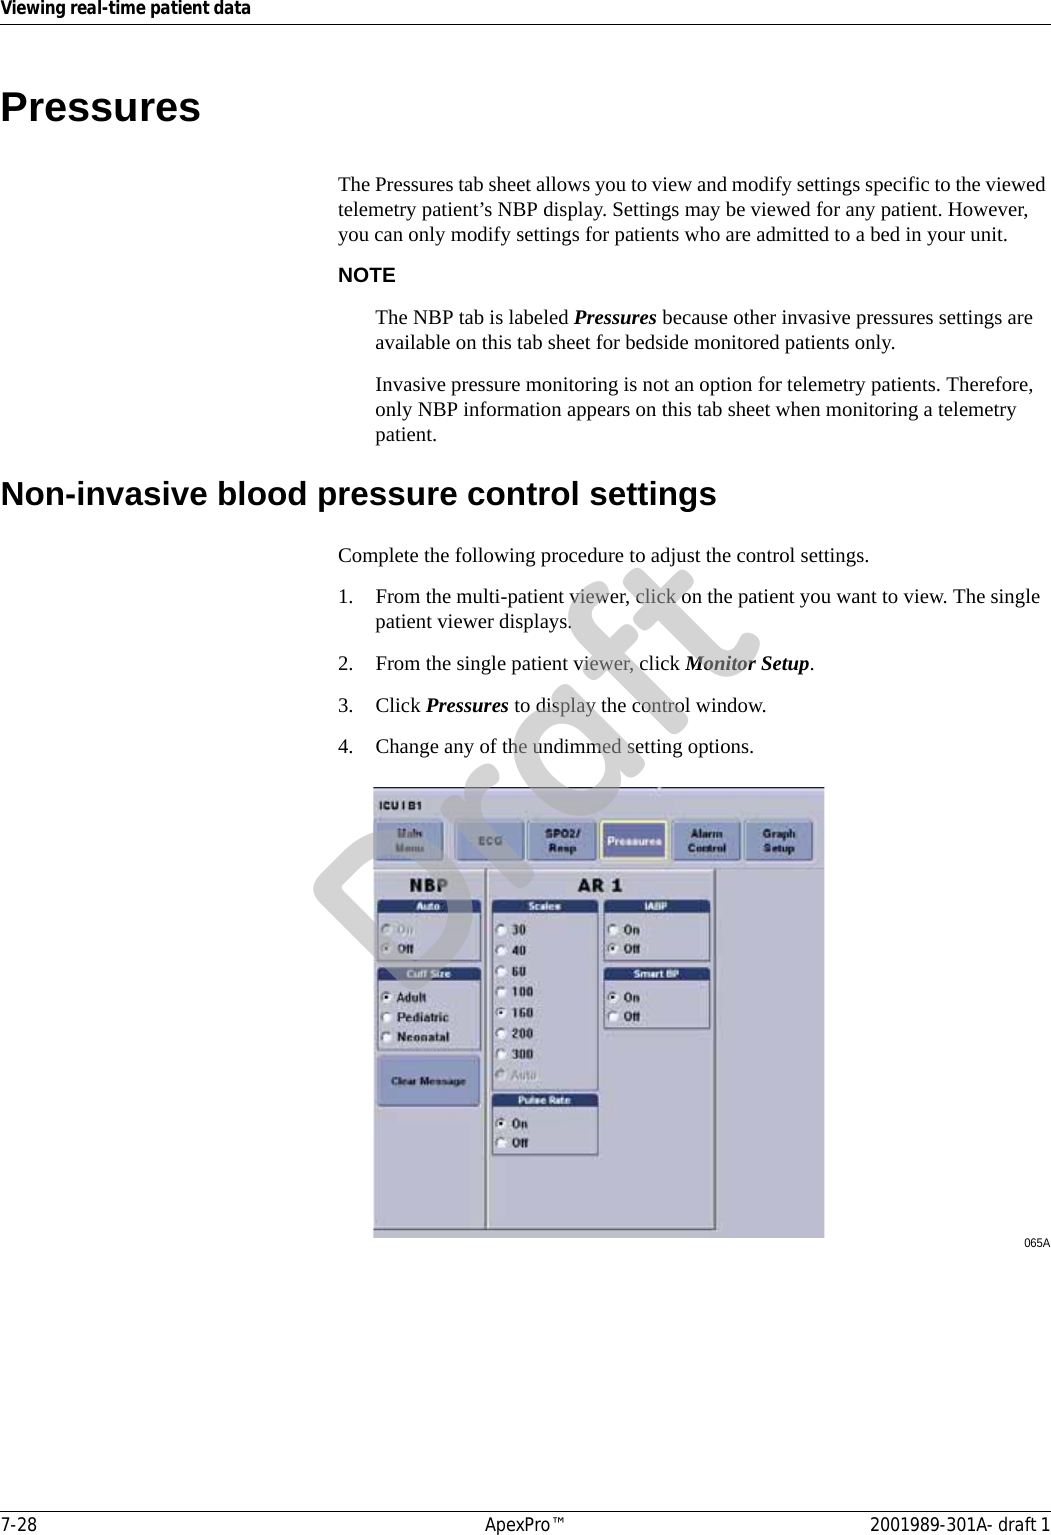
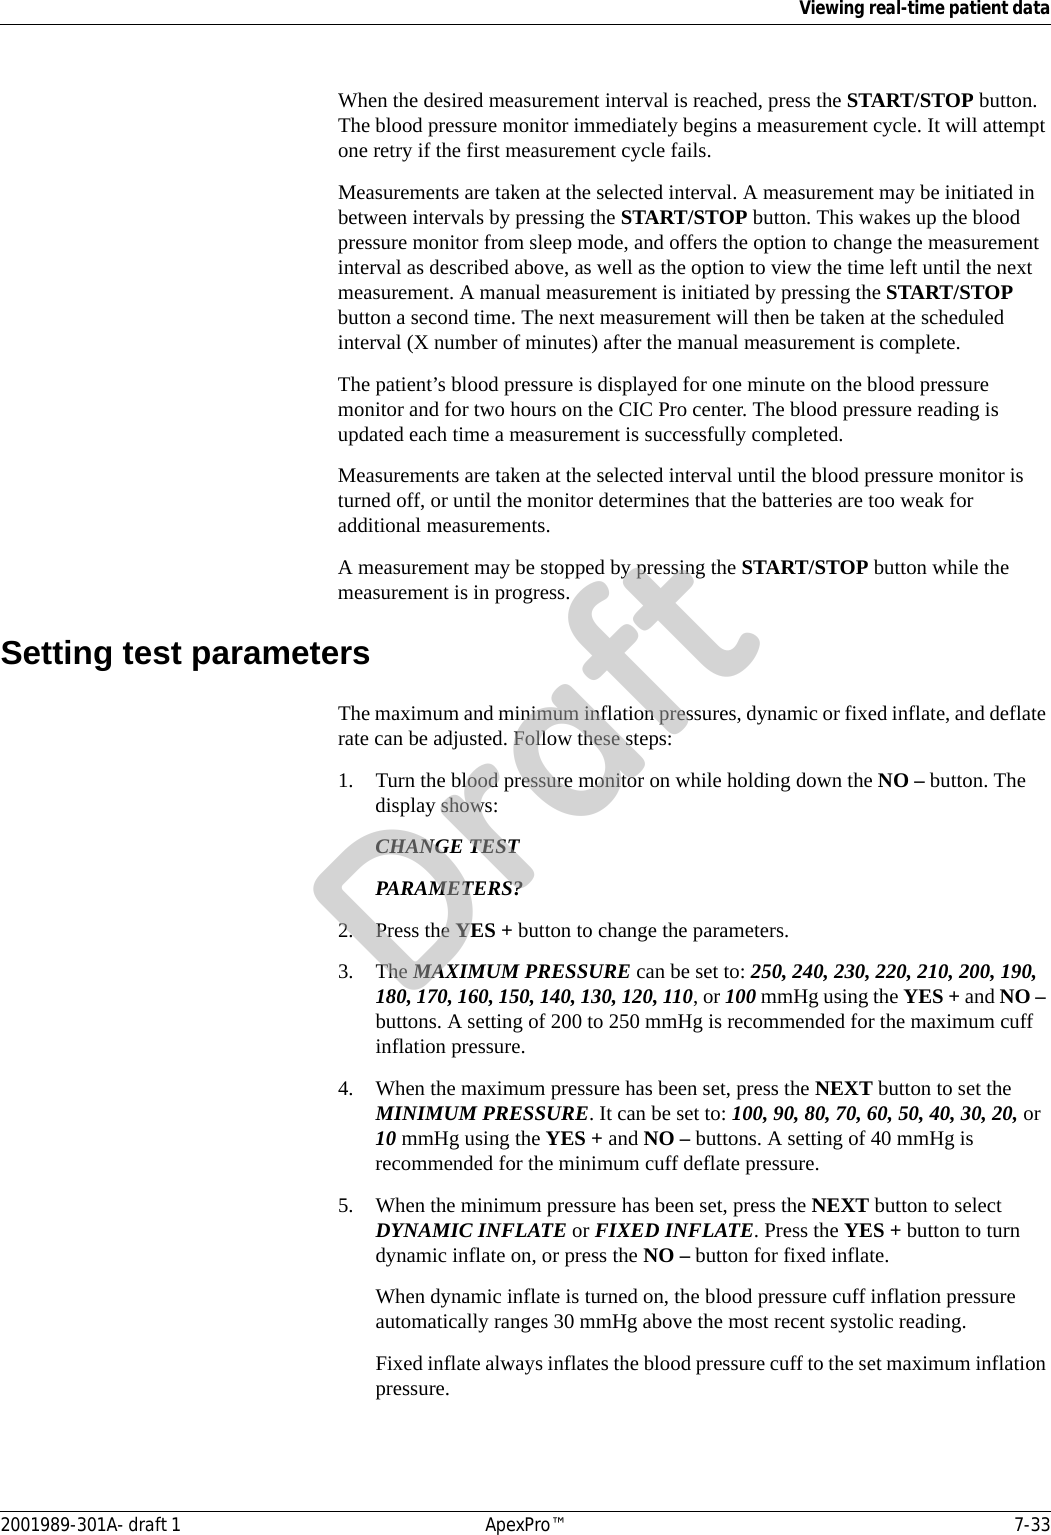

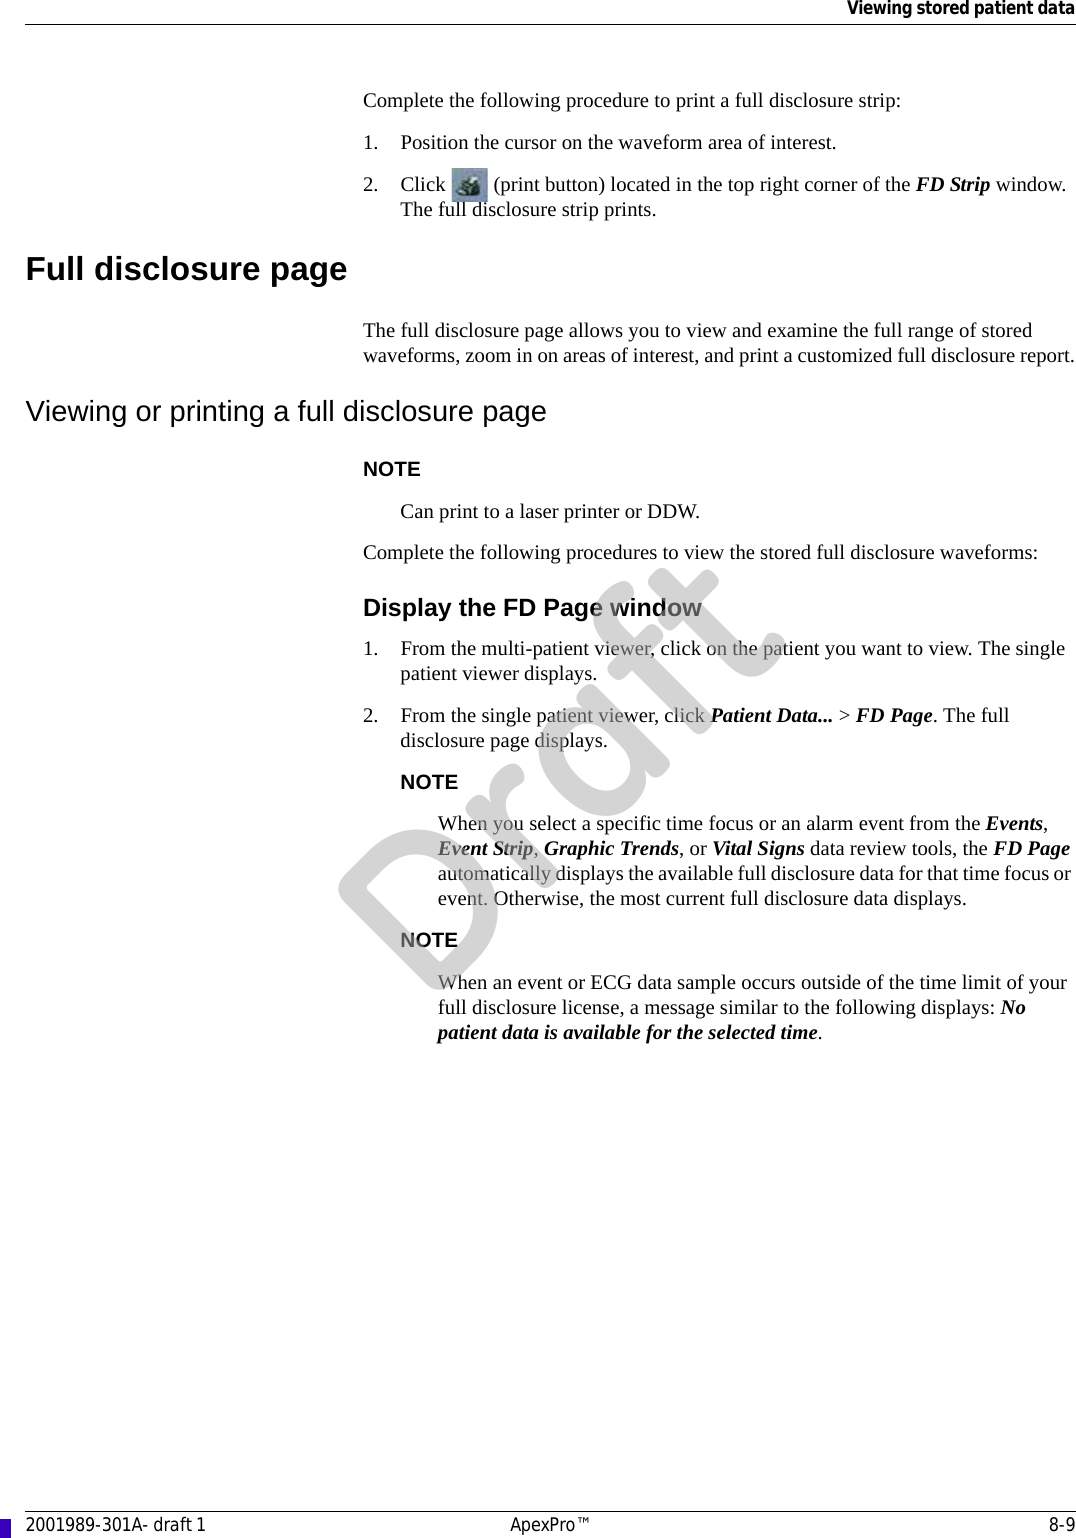
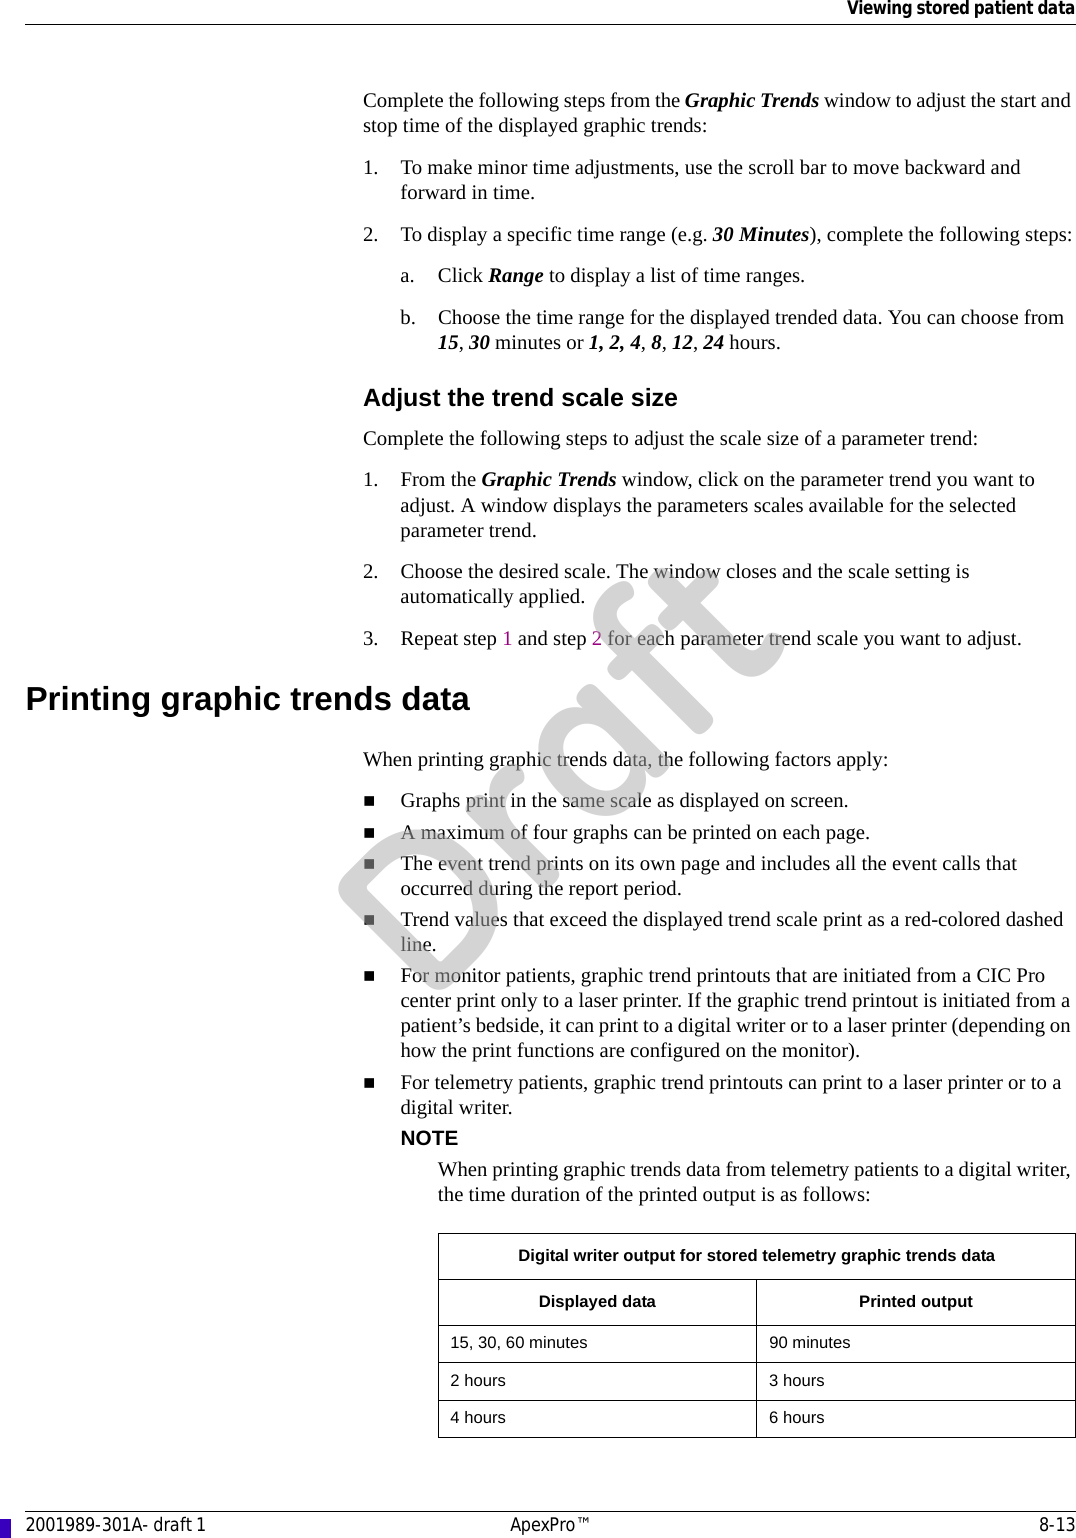
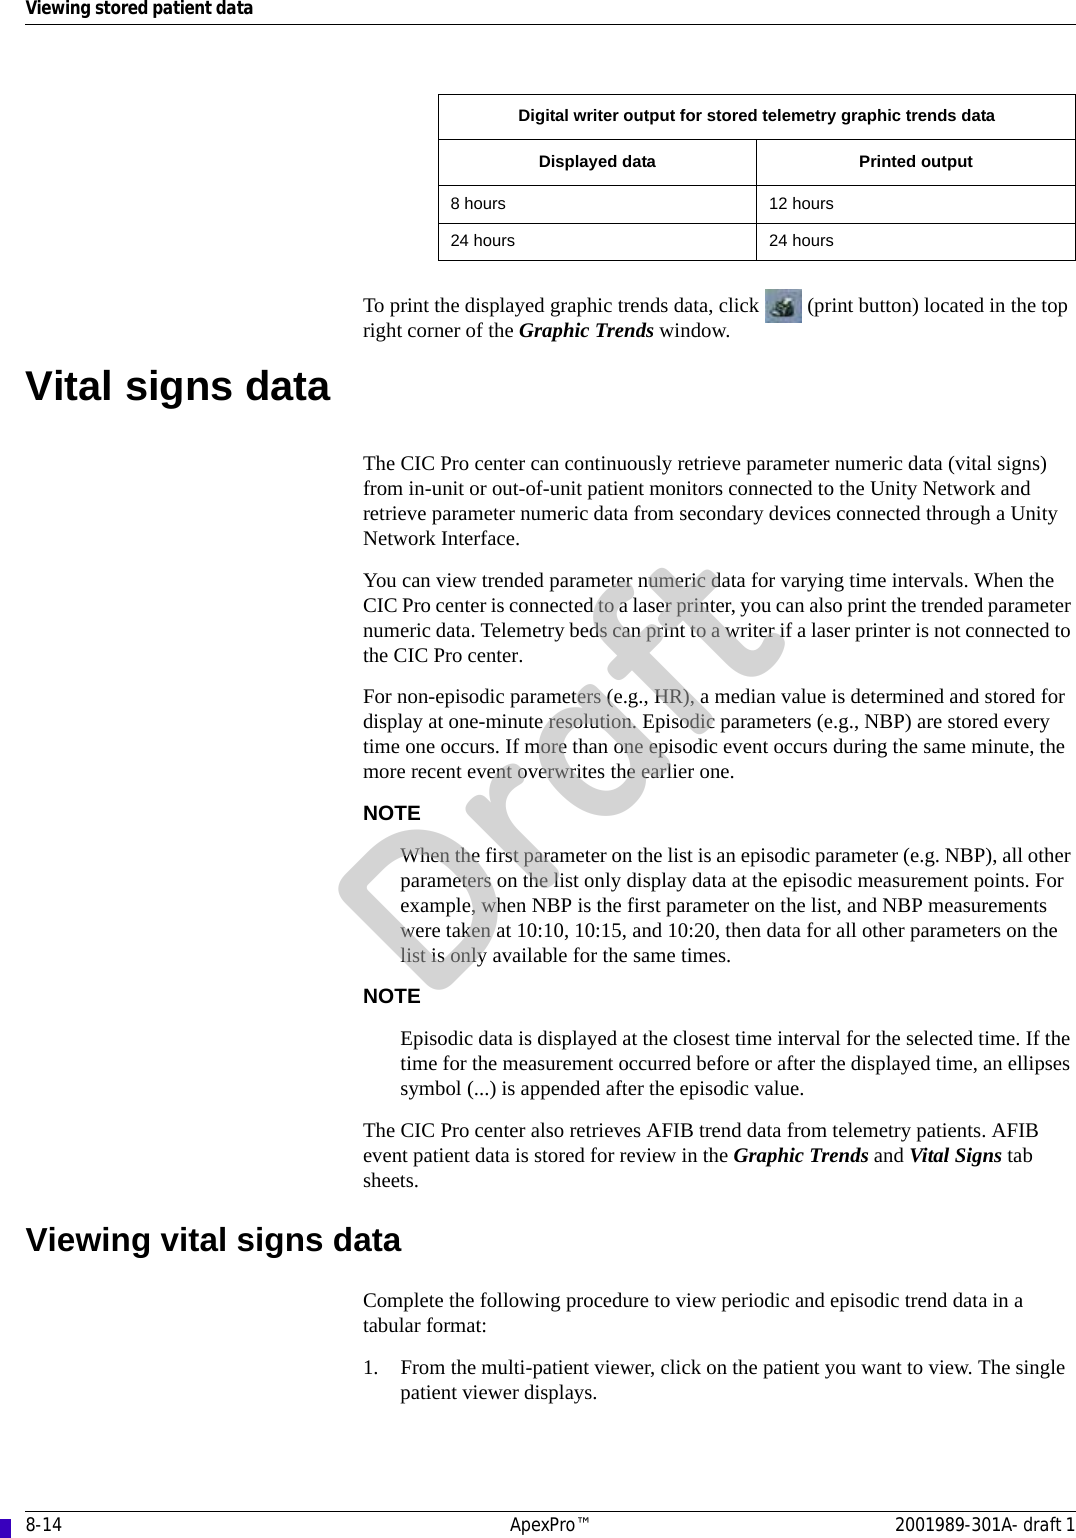
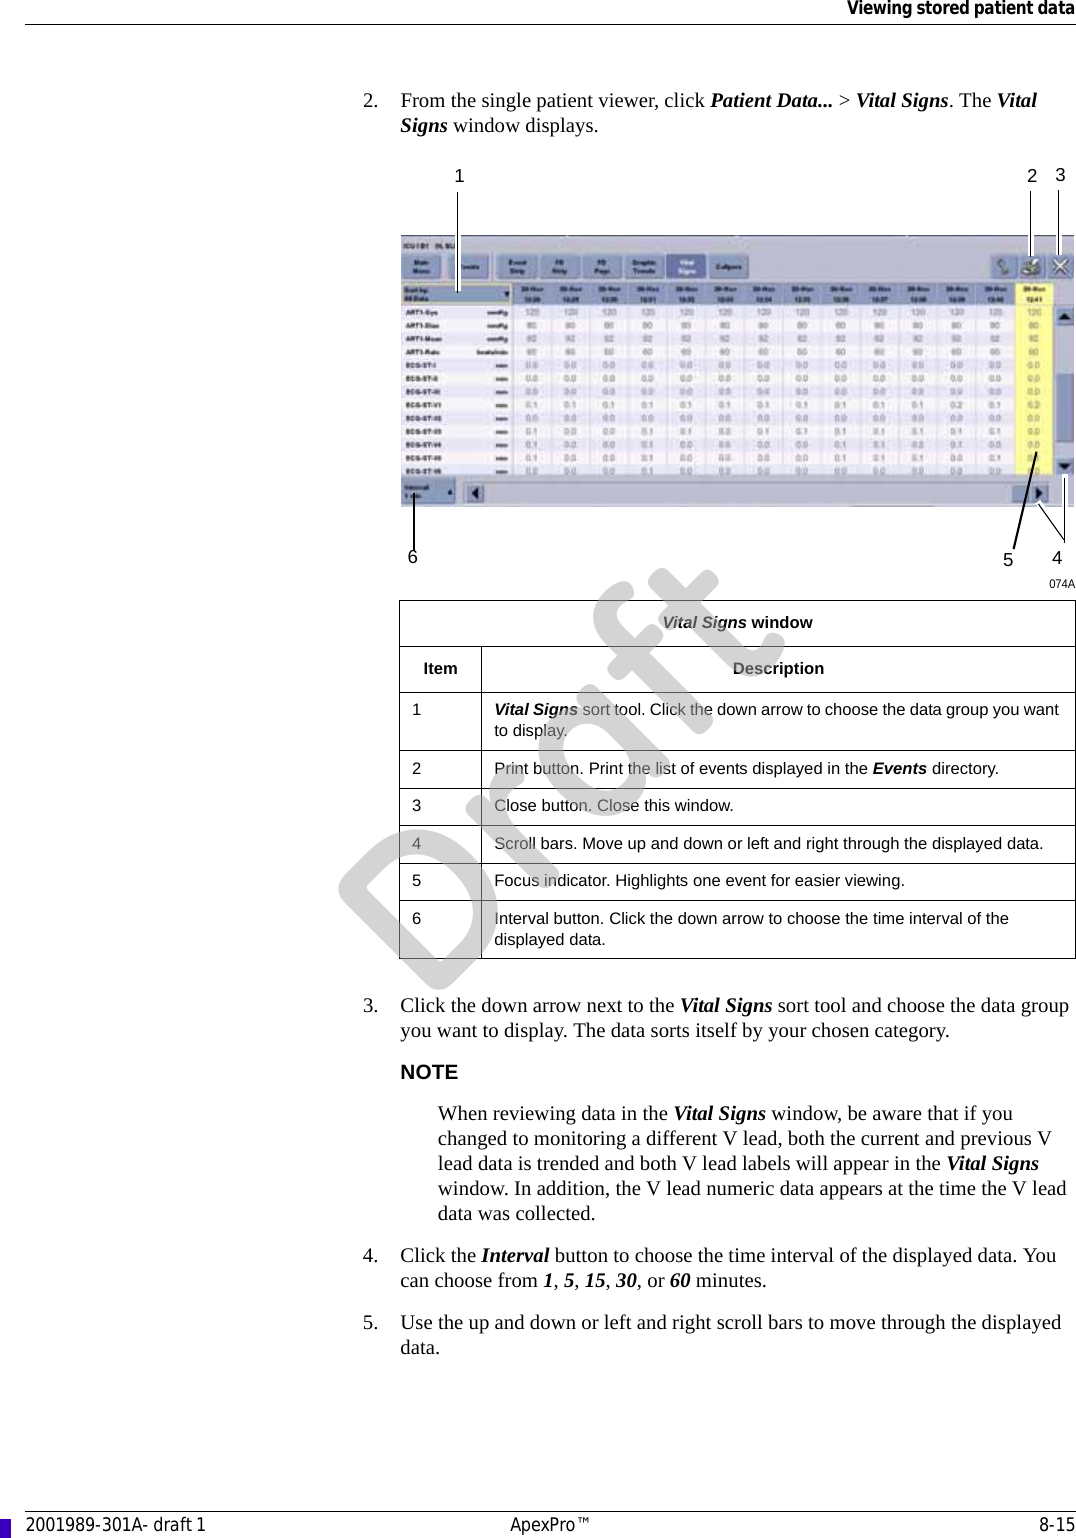
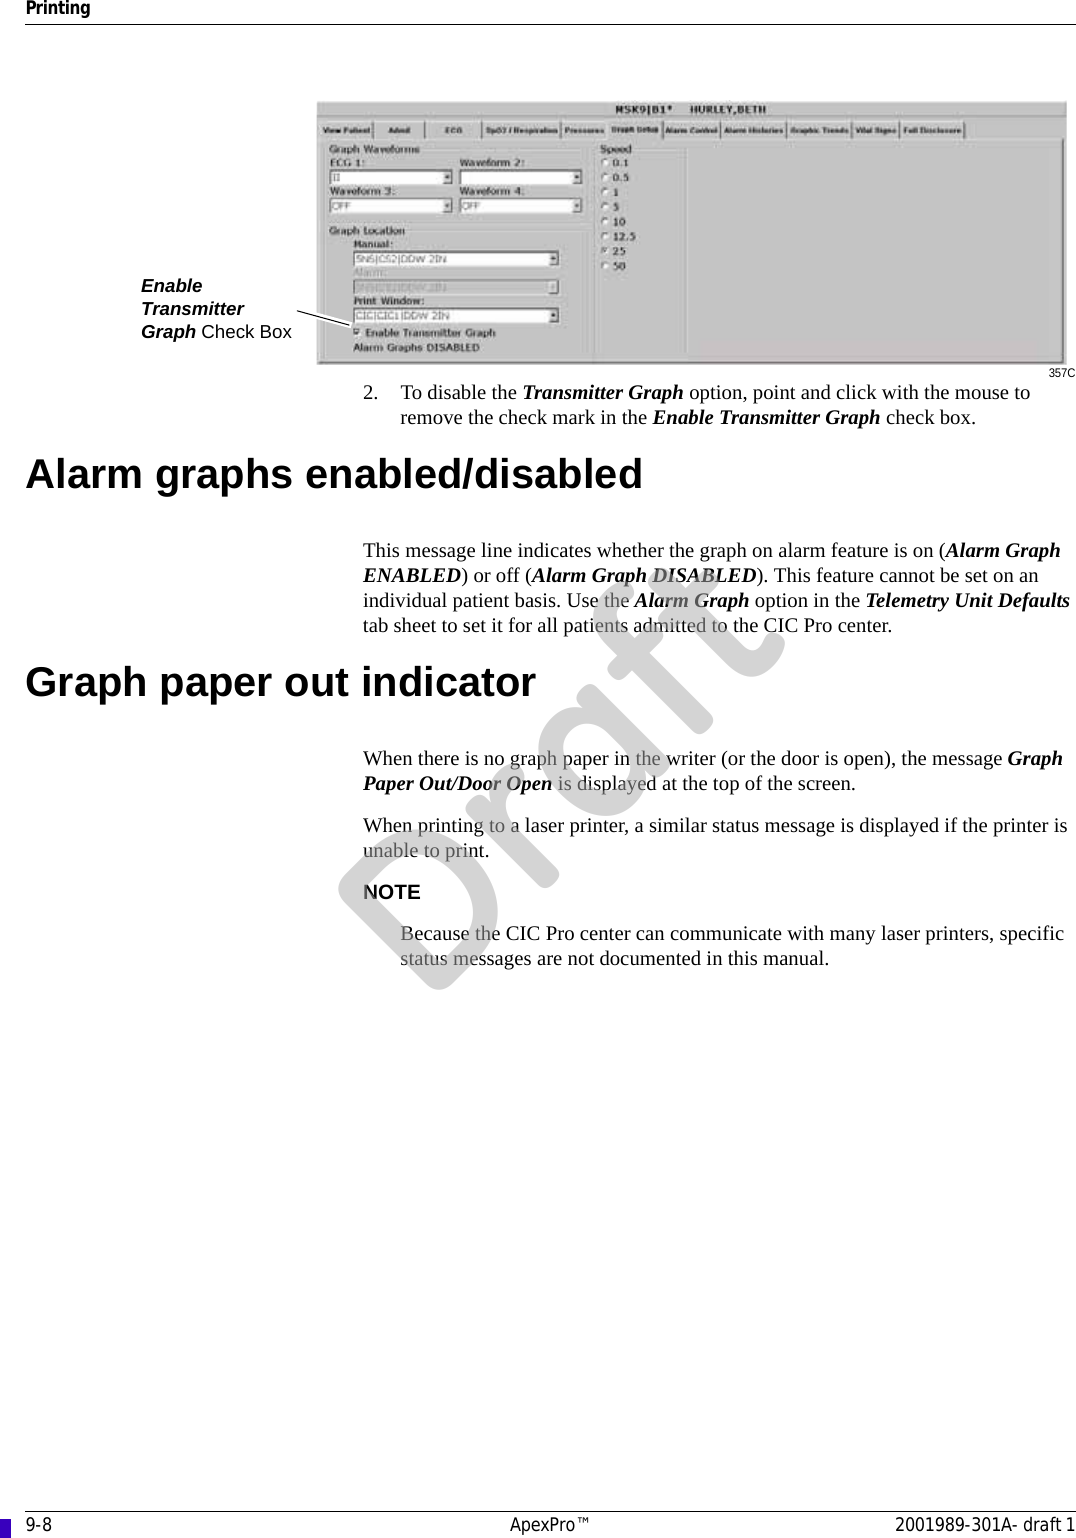
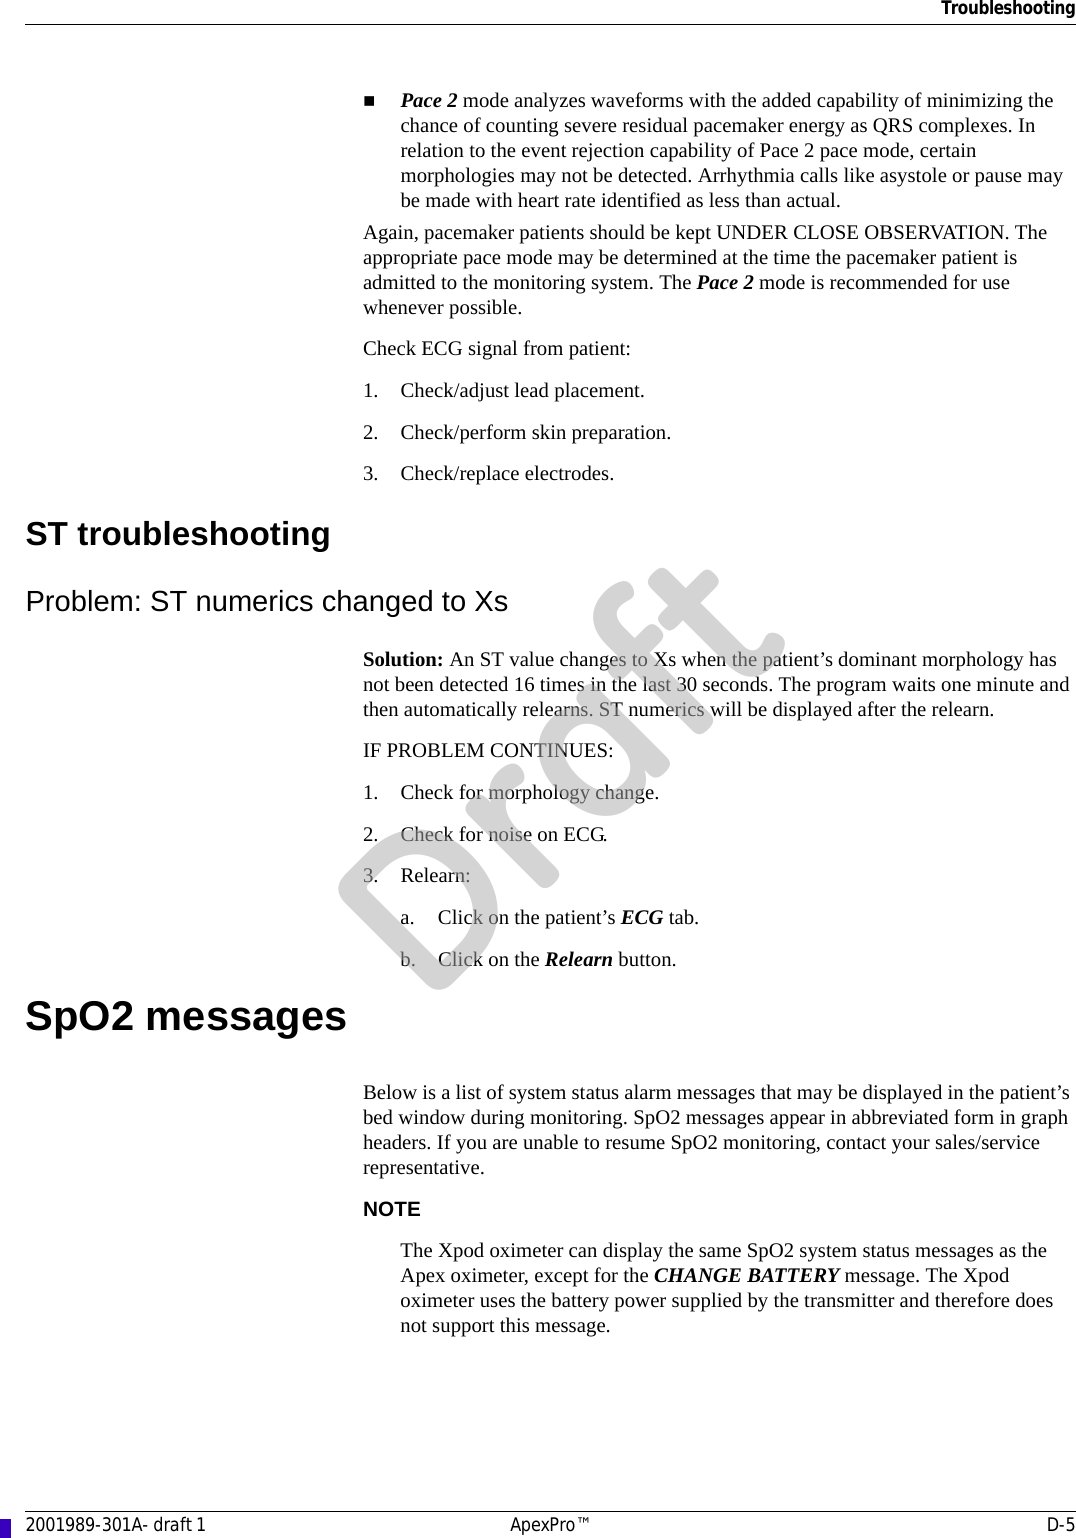
![8-4 ApexPro™ 2001989-301A- draft 1Viewing stored patient dataPrinting the Events directoryComplete the following procedure to print a list of events and data samples stored in the Events directory:1. From the single patient viewer, click Patient Data... > Events. The Events directory displays.2. Sort the data by event time or by event type.3. Click (print directory button) located under the Events directory to print the displayed list of events.Counting how many events occurredComplete the following procedure to identify how many events occurred in each event category (e.g. V TACH or VFIB/VTAC):1. From the single patient viewer, click Patient Data... > Events. The Events directory displays.2. When the Events list is not sorted by type, click the down arrow next to Sort by: Time and choose Sort by: Type from the displayed list. The list sorts itself by event category.3. Use the scroll bar to move up or down through the list. The quantity of each event category is listed in square brackets next to the event name (e.g. V TACH [2]).Identifying the most recent occurring eventComplete the following procedure to identify the most recent occurring event:1. From the single patient viewer, click Patient Data... > Events. The Events directory window displays.2. When the Events list is not sorted by date and time, click the down arrow next to Sort by: Type and choose Sort by: Time from the displayed list. The list sorts itself by event time.3. To move up or down through the list of events one at a time, click arrows located under the Events directory.Scroll bar. Move up or down through the directory.Print directory button. Print the list of events displayed in the Events directory.Up and down buttons. Move up or down through the directory one event at a time.Delete event button. Delete the selected event or data sample from the Events directory.Draft](https://usermanual.wiki/GE-Medical-Systems-Information-Technologies/2014748-002.Manual-Draft1-Part-7/User-Guide-881643-Page-37.png)