Mojo Networks SS300ATC60 SpectraGuard Access Point / Sensor User Manual 2
AirTight Networks, Inc. SpectraGuard Access Point / Sensor Users Manual 2
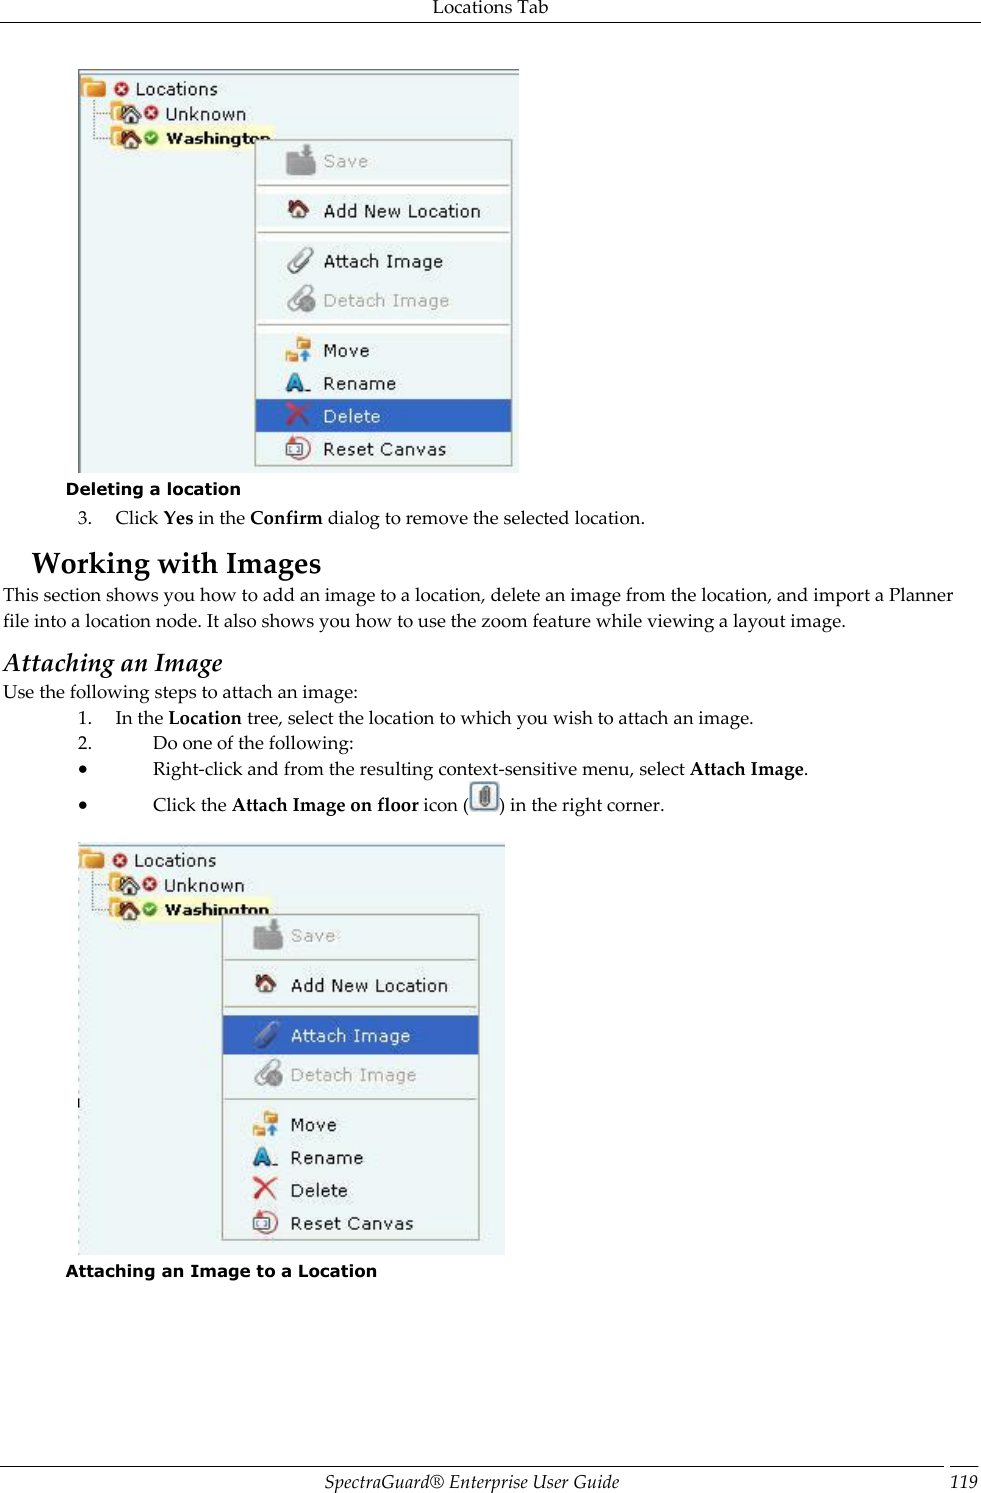
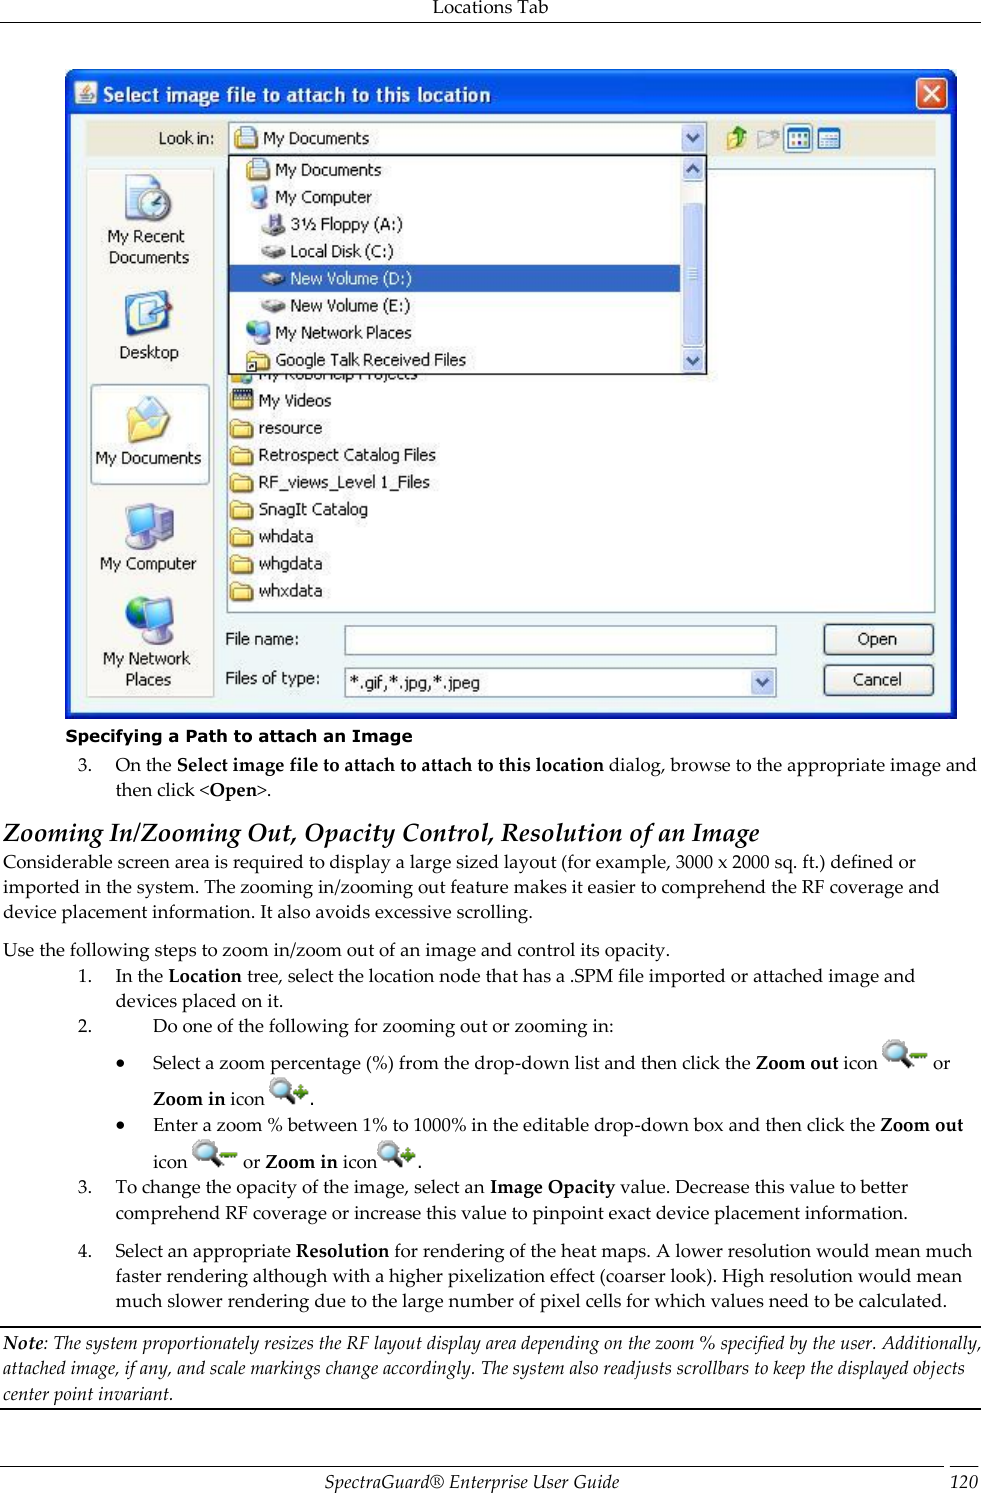
Contents
- 1. Users Manual
- 2. Users Manual-1
- 3. Users Manual-2
- 4. Users Manual-3
- 5. Users Manual-4
- 6. Users Manual-5
- 7. Users Manual-6
- 8. (SS-300AT-C-60) UserMan-Part1_2013.12.11 revised
- 9. (SS-300AT-C-60) UserMan-Part2
- 10. (SS-300AT-C-60) UserMan-Part3
- 11. (SS-300AT-C-60) UserMan-Part4
- 12. (SS-300AT-C-60) UserMan-Part5
- 13. (SS-300AT-C-60) UserMan-Part6
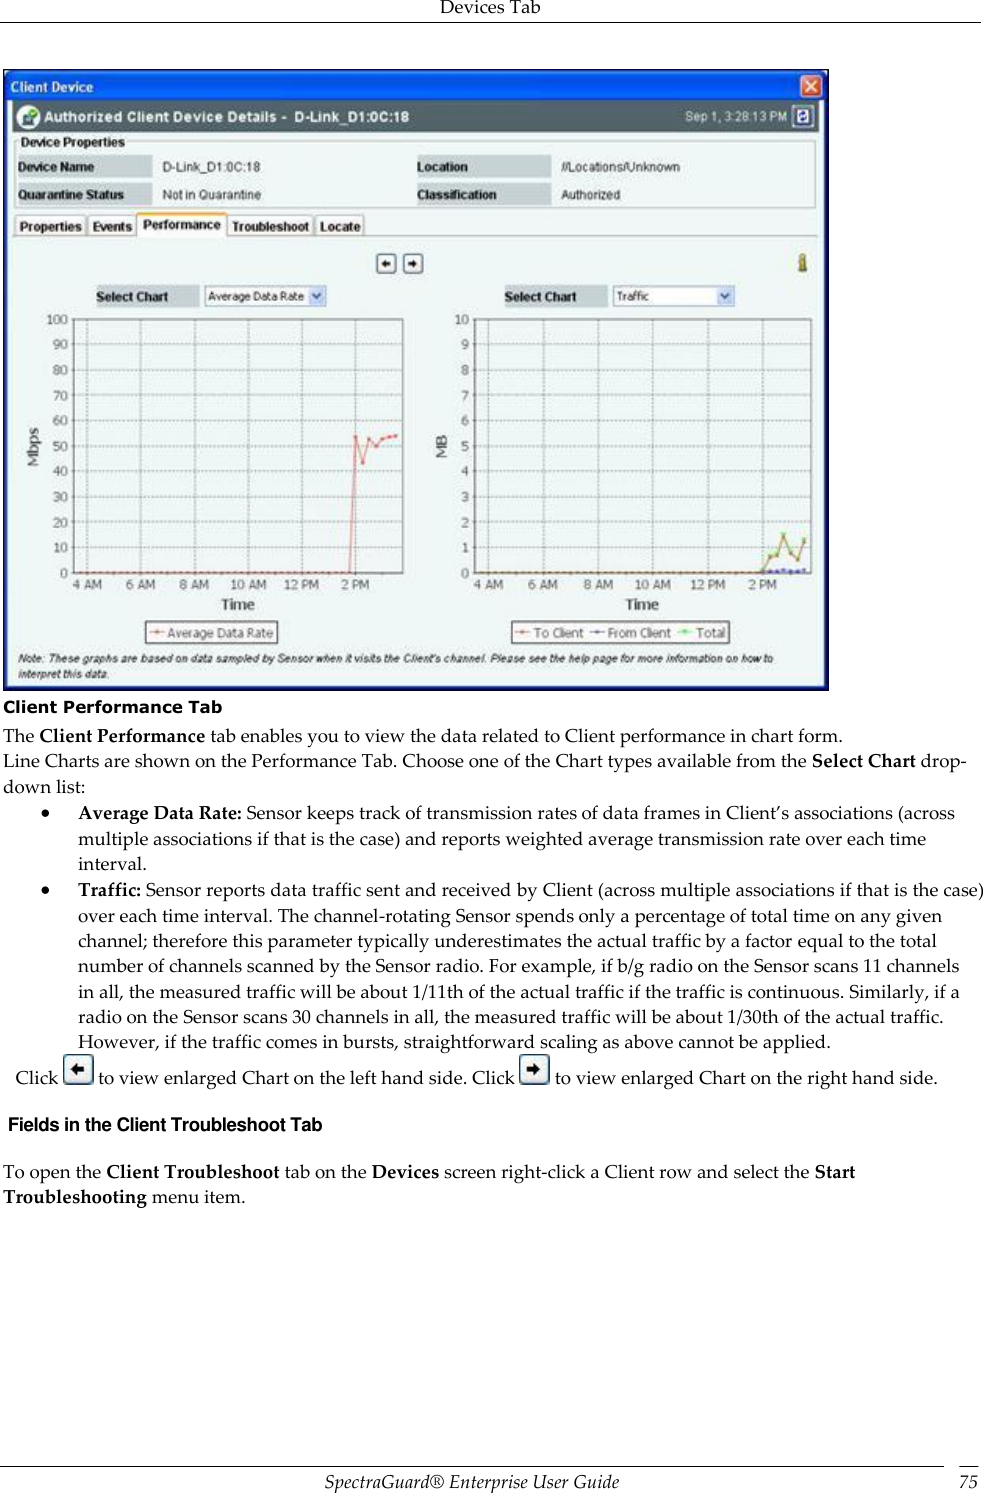
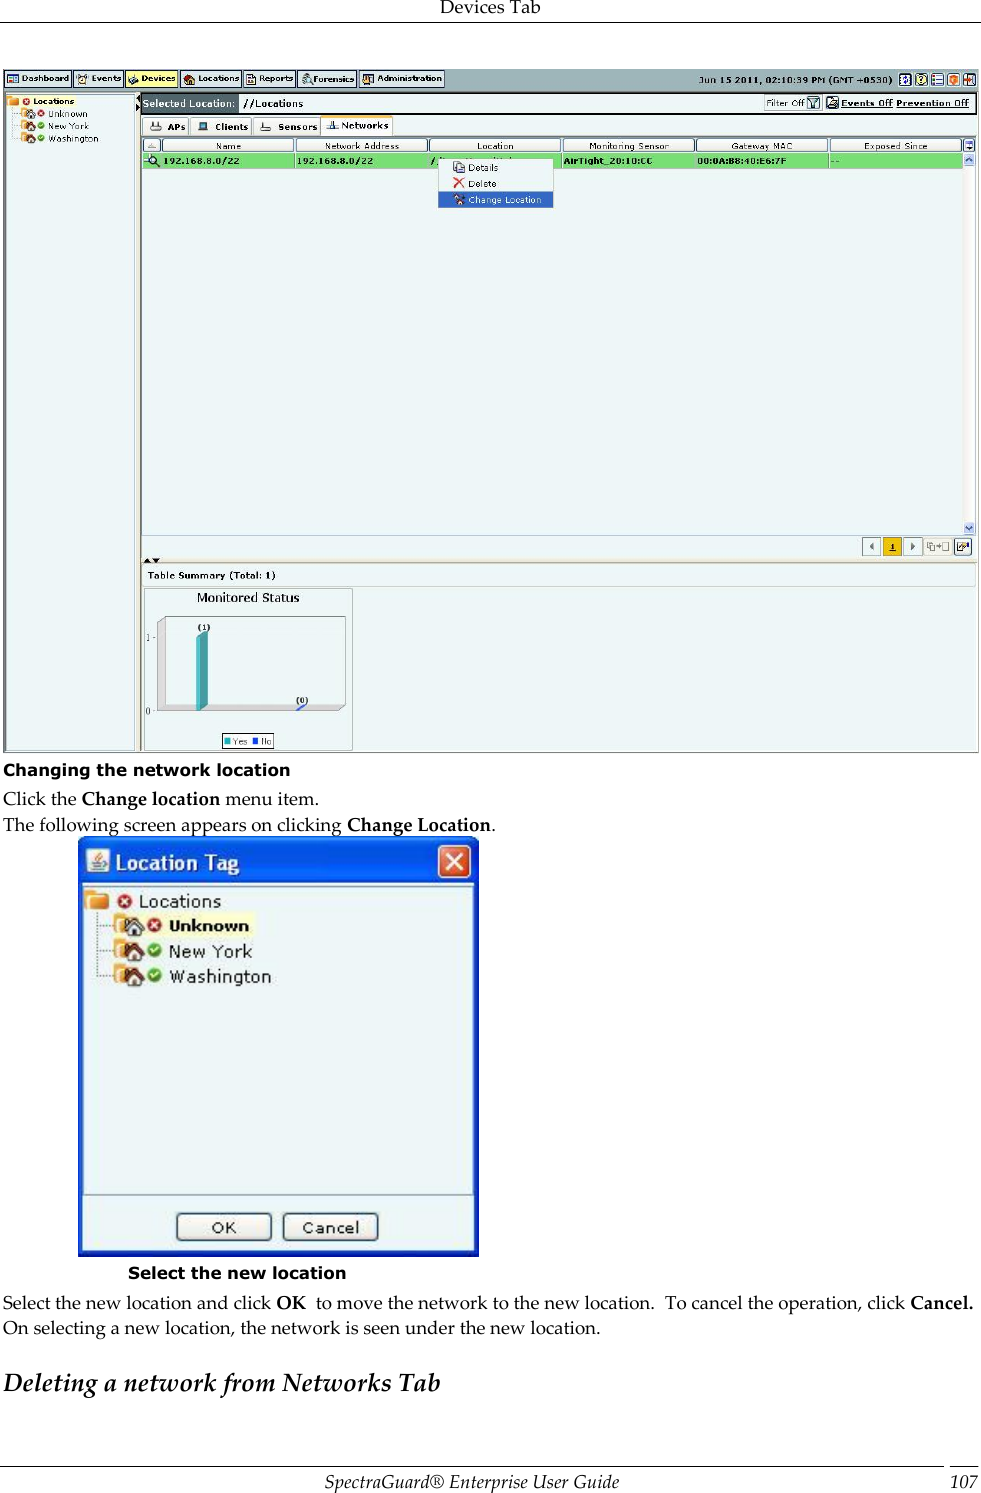
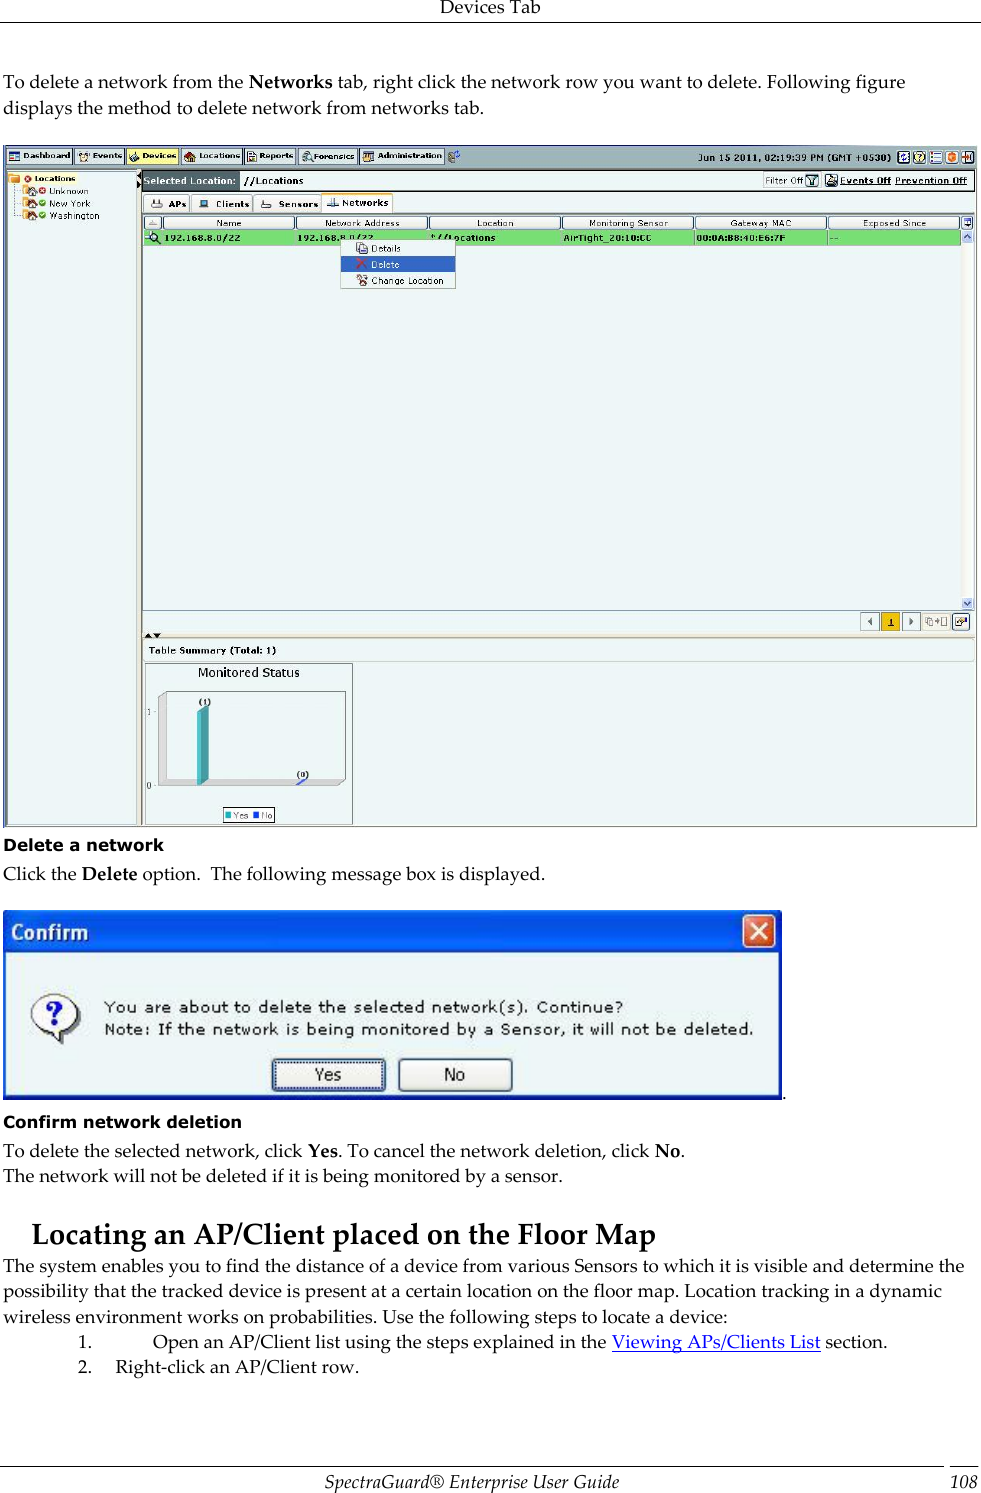
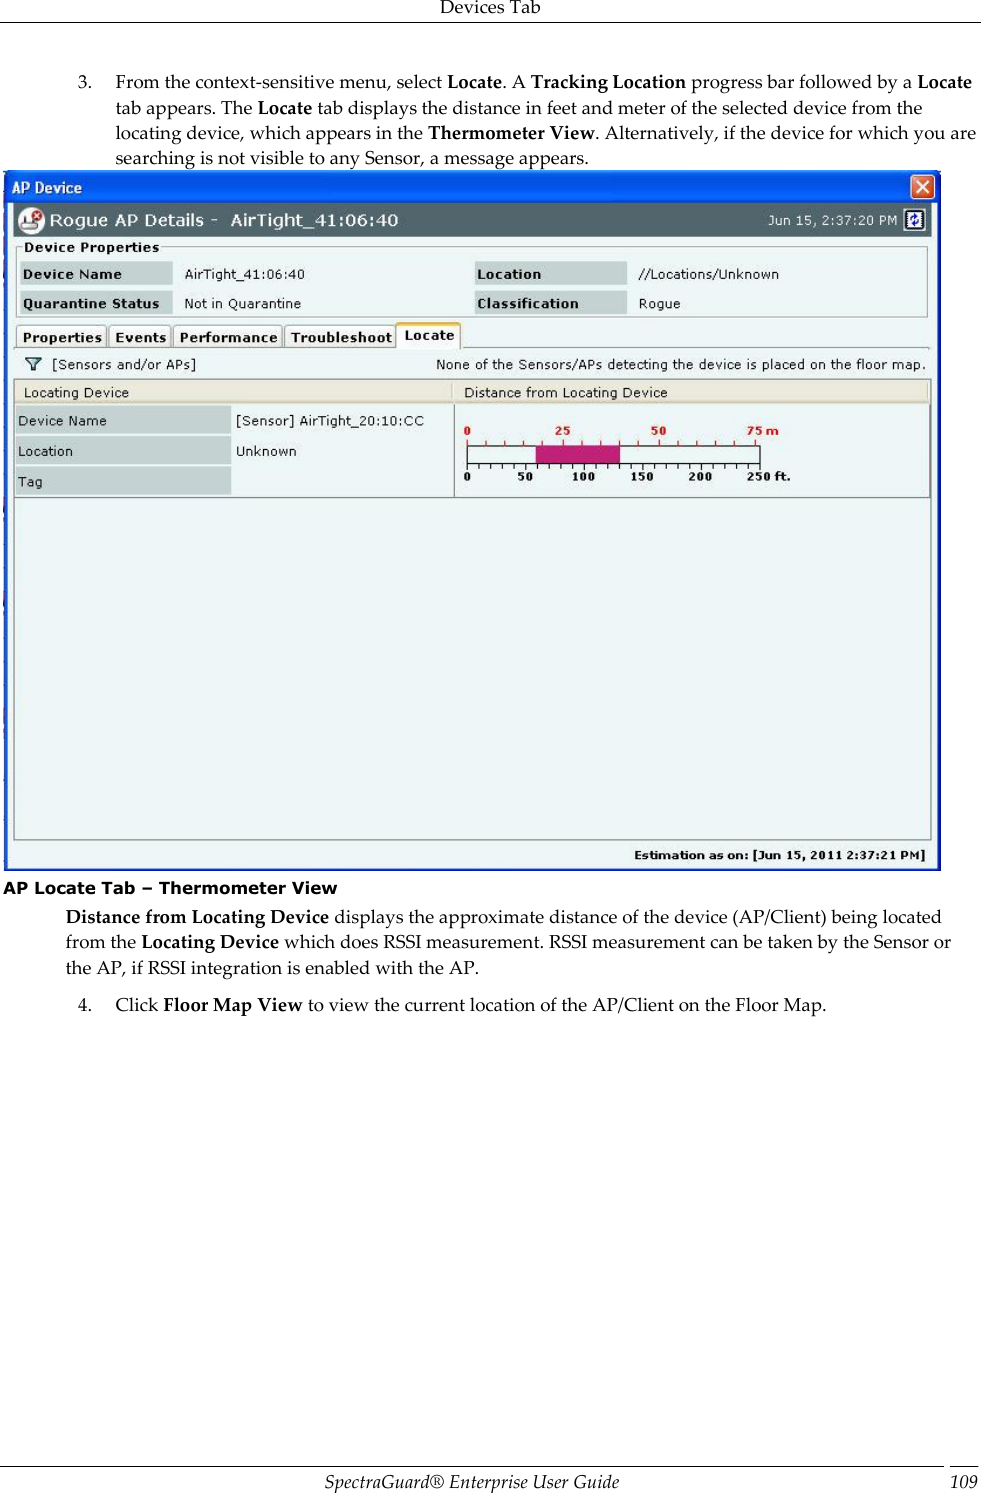
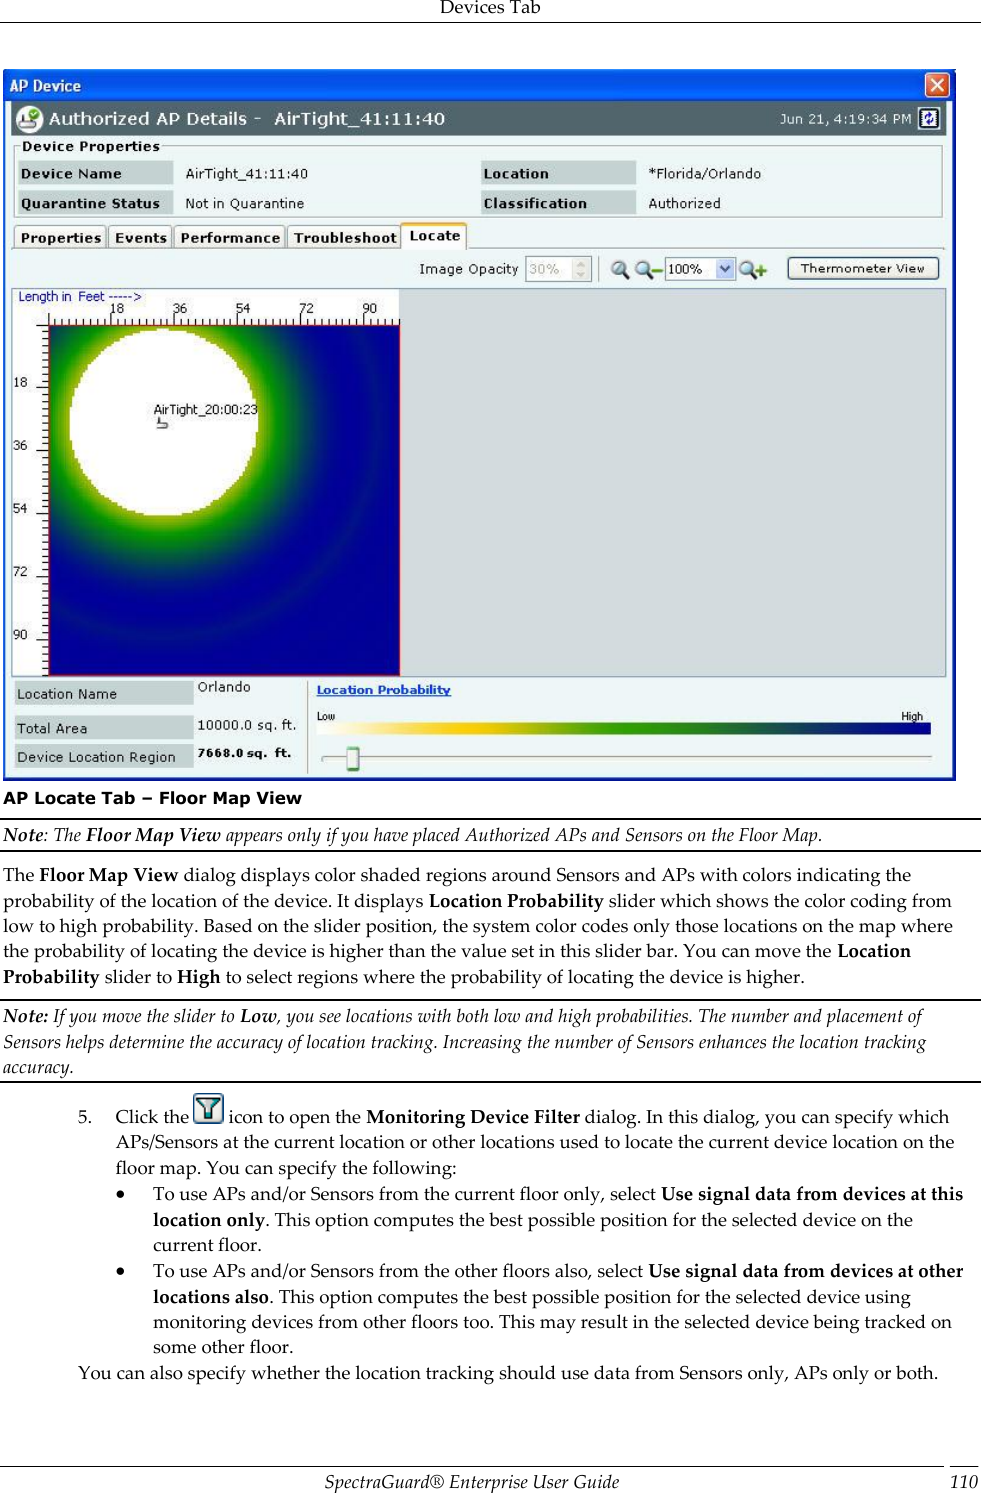
Users Manual-2